


If you are a prospective university entrant, parent, or guardian, this article is about overall trends. It will not help you with your acceptance or clearing application decision making (though this one might).
More England-domiciled 18 year olds have been placed at university on results day than in any year other than 2021. And the total number of England domiciled 18 year old applicants in the UCAS system is the second highest on record.
The much discussed decline in applications this year – the scene of much celebration in certain parts of the commentariat – has been among mature students, in particular those over 25.
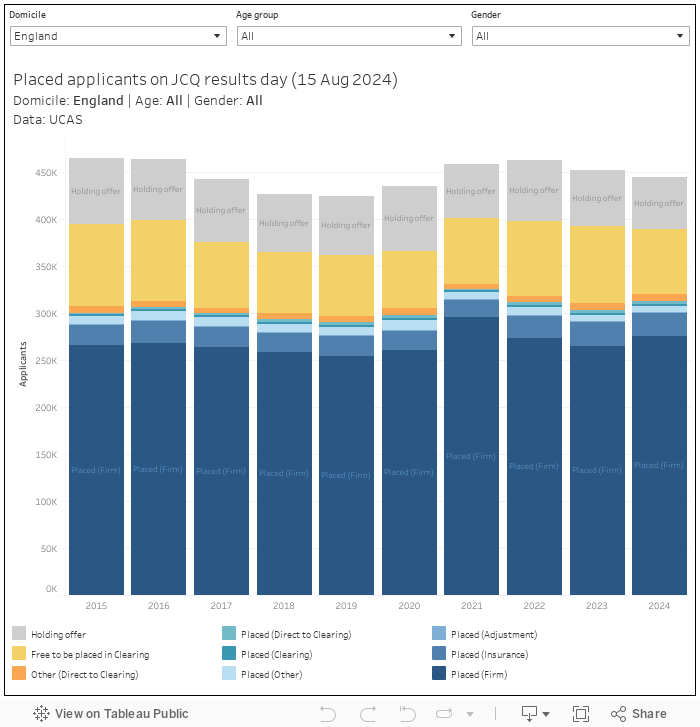
Applicant status
In most cases, the meaningful comparisons are with pre-pandemic years. Excluding 2022 and 2023, this will be the busiest clearing on record – with 34,830 applicants free to be placed in clearing on results day – but the number of applicants placed at their firm choice of course and provider is the highest outside of 2021.
This may well be the final nail in the coffin for the Lifelong Learning Entitlement (LLE) – the Johnson administration scheme to widen access to fee loans in order to cover shorter courses never managed to demonstrate a demand for such products among mature applicants. The combination of fees and time commitments seems not to be working for the over 25s.
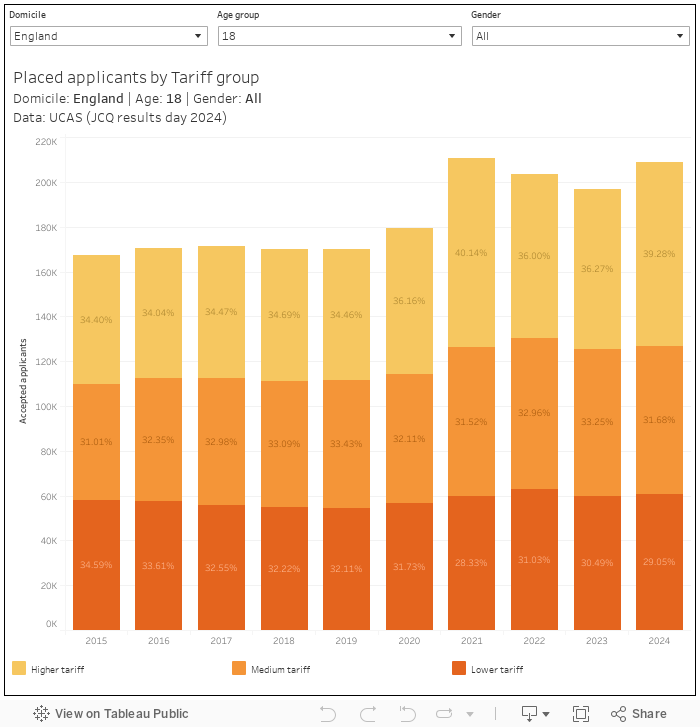
Placed applicants by tariff
Applicants are overwhelmingly choosing high tariff providers. Some 37.7 per cent of placed applicants have a place at a “high tariff” provider on results day – the highest proportion on record. If you look specifically at England domiciled 18 year olds the figure is 39 per cent, the highest outside of 2021.
And 67 per cent of non-EU international placed students have a place at a high tariff provider – the highest proportion since 2021 and the highest number since 2022.
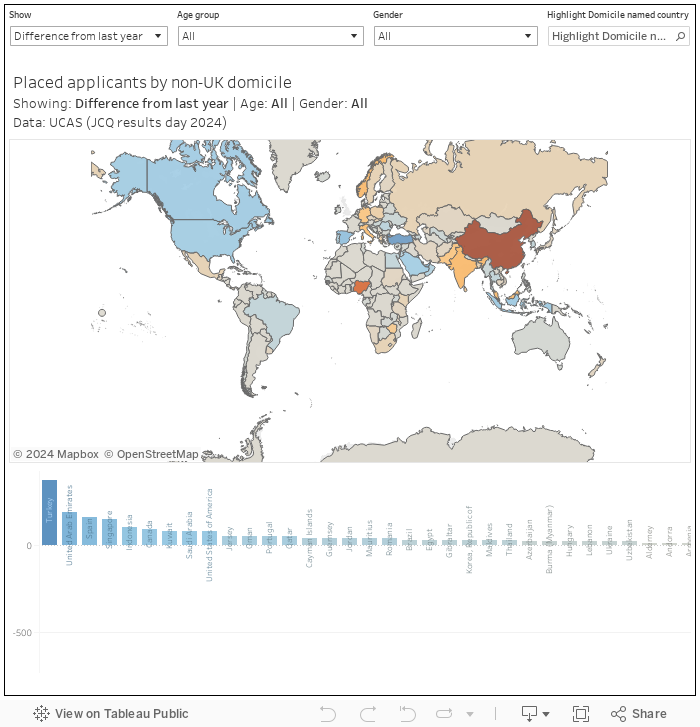
Placed non-UK applicants by domicile
The much discussed drop in applicants from China and Nigeria is notable, but perhaps smaller than anticipated (when we consider placed applicants). The year on year decline from China was 680 on an annual recruitment of over 10,000, whereas the decline from Nigeria was 450 (down by about 40 per cent on last year).
Of course, this is UCAS data – there’s nothing here on postgraduate taught recruitment, and this is arguably going to be the biggest issue for the coming year.
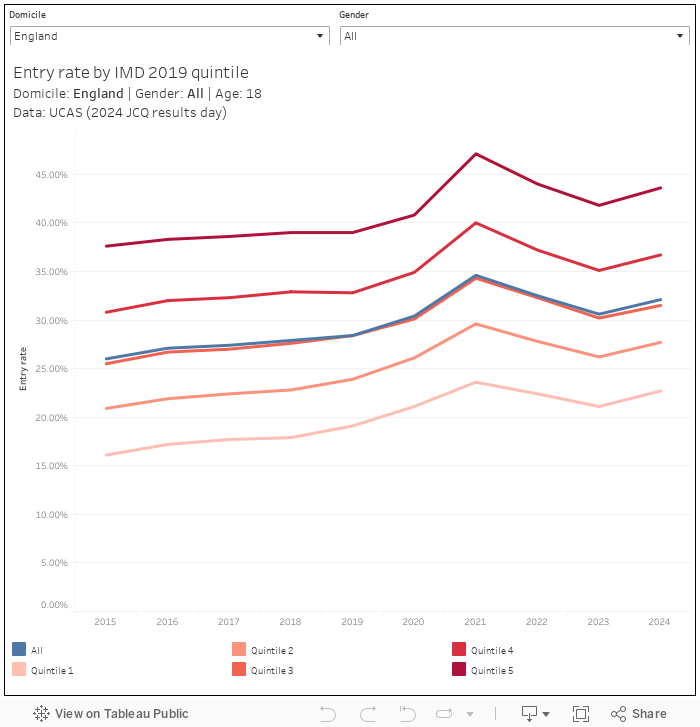
The number of English 18 year olds from IMD quintile 1 (the most disadvantaged areas of England) was 33,700: the highest number (and, at 22.7% the highest entry rate) on record. However this should be seen in the context of an overall entry rate of 32.1% and a rate of 46.3% among the most advantage quintile of areas.
A levels
A level results are broadly comparable to 2023, and have fully returned to pre-pandemic proportions (as planned) in every nation of the UK. There are very slightly higher proportions of pupils achieving the highest (A* and A) grades compared to last year. On average, each A level student took 2.59 A levels this year.
Subject by year
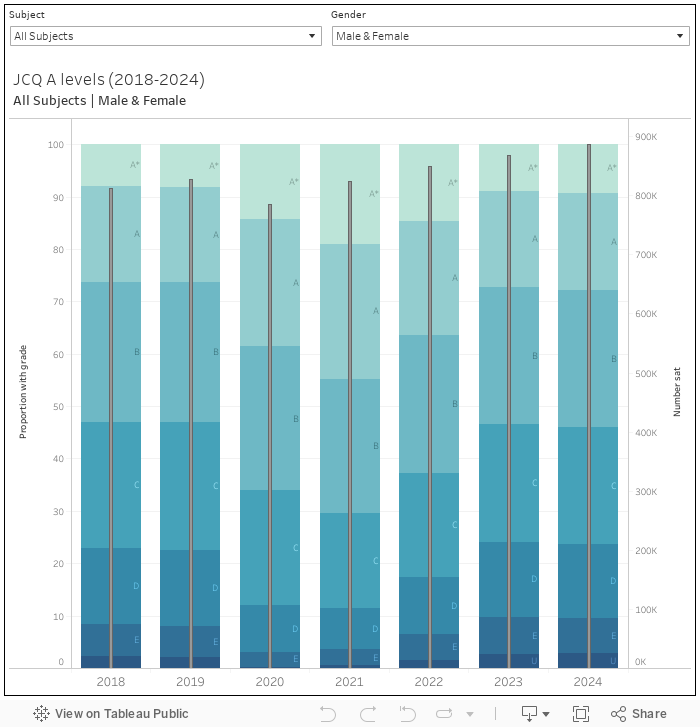
Select your subject of interest using the dropdown (defaults to “All subjects”) and a gender (Male, Female, Male and Female). The graduated blue bars show the proportion of those who sat the exam each year since 2018 with each grade – a darker colour means a lower grade. The thin grey bar, which refers to the right-hand axis, shows the number who sat each exam.
Year on year comparison
There are only very slight differences year on year by subject – you were very slightly more likely to get a grade between A* and C last year than this in sociology, business, and English language: though 2024 was an “easier” year for students of French, drama, and chemistry. The “hardest” subject to succeed in remains Law (63.7 per cent got between A* and C this year) – the “easiest” subject is “other modern languages” (94.1 per cent).
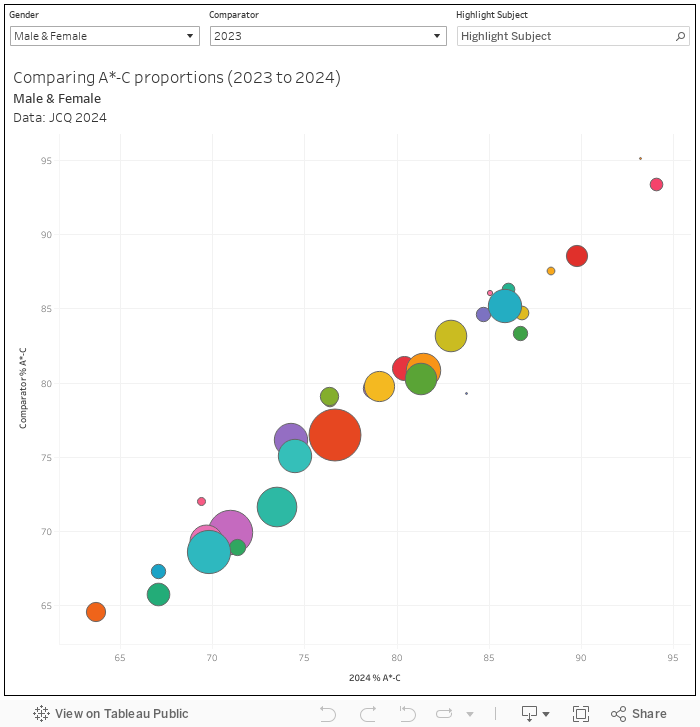
This chart allows you to compare the proportion of those who sat and gained grades A*-C in each subject, between this year and either 2019 or 2023 (choose your preferred year using the drop-down) – you can also select gender (as above) and highlight the subject you are interested in. The size of the blobs shows the number that sat exams in each subject.
Other level three qualifications
This isn’t just A level results day of course (though A levels remain the dominant entry qualification to higher education. Around 7,380 students took T levels (88.7 per cent, or 6,543, passed them). This year, 16 T levels were are available, with eight new for this year.
And there were 250,000 entries to vocational and technical qualifications (217,600 to Applied General qualifications and 32,400 to Tech Levels). These qualifications range in size and coverage from equivalent to half an A level to an equivalent of three – there are 245 individual awards in this bucket. Some 22,100 got a top grade.
Results by county, results by centre type
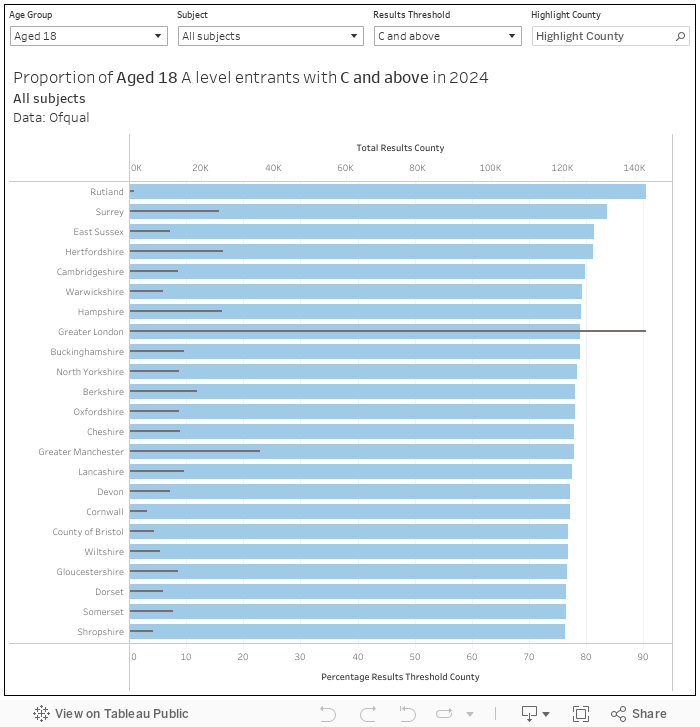
Ofqual provides some additional data on results day – this ranking of results by county caught my eye, though the list of counties involved seems utterly arbitrary (I can assure you South Gloucestershire exists!)
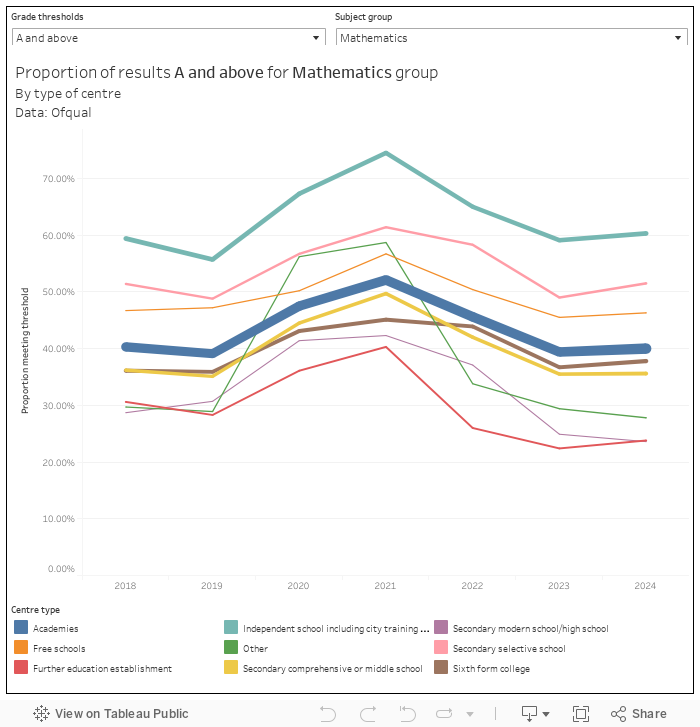
But there will rightly be more attention paid to the results by centre type – demonstrating the continued advantage conferred to pupils whose parents can pay for their compulsory education.
Ofqual define counties using the 1997 Lieutenancies Act which was a law designed to separate crown representation from local government reorganisation. I haven’t seen any other statisticians use these definitions.
Centre type is based on descriptions held in the database used by the main awarding organisations and may not be entirely accurate. Some non selective 11-18 secondaries are quite selective when it comes to 16+ admissions. Colleges dissolve when they merge whereas academies retain their centre numbers
Etc
Can you share the data source for Other level three qualifications. It seems really difficult to find anything about this huge group of qualifications . About 20% of the results released today with barely any mention or data