


Do we need to look at funding Creative Arts and Design differently in England?
That would seem to be the pressing question from last week’s Longitudinal Earnings Outcomes release. As someone who works in a large specialist, I will admit to some hesitation before writing that first sentence.
I warned in The Great University Gamble about the ‘financialisation’ of the sector as the necessary consequence of fee enthusiasm. LEO is the realisation of that prediction: it cannot be ignored or suppressed and so we need to grapple with it. It’s the delayed price for the bargain that university leaders have struck.
If we’re not yet ready for the full-scale abolition of tuition fees, we may need to recognise that some important parts of the sector cannot thrive in this current climate. That means we will need to talk about pockets of planned provision funded differently. Creative Arts and Design faces particular problems that must be addressed head-on before some kneejerk policy botch is applied, or nudges and markets precipitate a crisis.
It requires only a cursory familiarity with the graduate labour market to know that most of the subjects grouped under the heading of Creative Arts and Design don’t sit well with England’s generalised fee-loan regime. Fine Art, Dance and Crafts are not central to the production and reproduction of the professional classes, whose future members – through loan repayments and higher income tax (the “Exchequer benefit”) – are meant to contribute to the cost of the studies pursued by their earlier selves.
For critics, the commitment to loan over £50,000 to so many future low earners is an expensive misallocation of resources that could be better directed including, if necessary, by limiting student choice or the financial support available. Had the recent General Election gone as most people anticipated, then such considerations might have been the focus of the major ‘value for money’ review promised in the Conservative manifesto. What might be seen as post-2012 collateral damage for the creative subjects could have developed into something more deliberate. It still might.
The power of LEO compels you
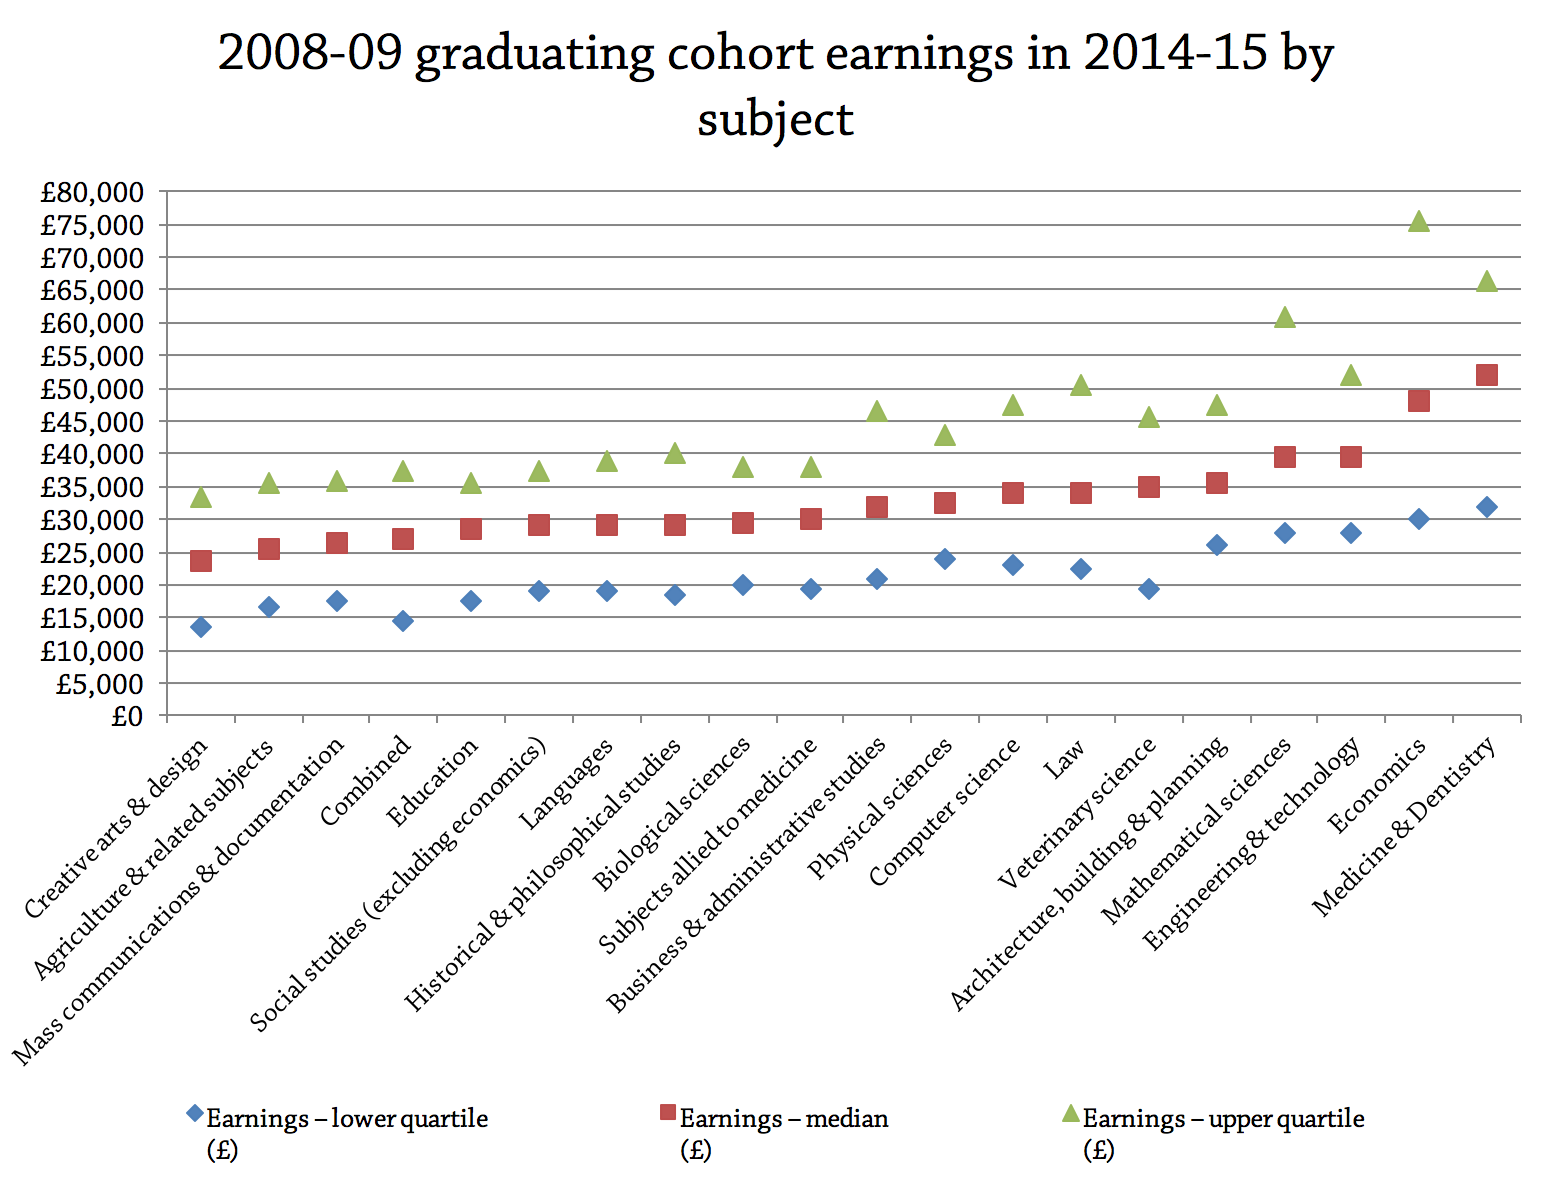
As it is, LEO’s experimental series has now extended December’s data on graduate earnings in 2014/15 by providing a breakdown by subject and institution, with a focus on the cohort who graduated in 2008/09 and who were therefore roughly five years into their earning careers.
For all the caveats about LEO, it does show the subjects and institutions where the government most subsidises study. It will, therefore, be central to any discussion about the future shape of the sector. A market fundamentalist may prefer LEO’s information to ‘nudge’ student choice (the latest documents moot using careers advisors to promote the findings), and these results look likely to be incorporated into the basket of TEF metrics. But as universities eagerly increase fees, and so put further upwards pressure on the government’s annual loan outlay, it is not hard to envisage LEO directing bids to reform student numbers, loan access, or fee and loan levels.
Indeed, this was the thrust behind both the legislative changes in 2015 that allowed LEO to commence: that we would learn about ‘good’ universities and gain insights into social mobility.
Recall last year’s White Paper:
At an aggregate level, by enabling more authoritative data to be produced of the employment and earnings of graduates long after they have completed their education, we will be able to facilitate an improved understanding of the value added by a higher education degree.
This understanding of value add will offer a different narrative to the coming TEF. Earnings in this raw and pure form primarily benefit the prestigious universities with high tariffs, well-heeled students, and first dibs on jobs in the City.
Human capital theory might argue that earnings are a good proxy for the productivity gain associated with good teaching, but LEO’s raw data is no such ‘value add’ measure since it is not factored for prior attainment, family wealth, gender, and more.
The only benchmarking here is the minimum imposed from the outside – how does the return on that subject at this university compare to others? In all subjects except for Creative Arts (and to some extent Mass Communication & Documentation), graduate earnings assume prominence in the labour market.
2016 graduate labour market data marked the median salary for the ‘young’ non-graduate (21-30 year-olds) at £19,000pa, rising to £22,500pa for all non-graduates (16-64). This compares to a median of £32,000 for all graduates. For all under 30s (graduates and non-graduates), the median male income in 2016 was £26,000 for men and £23,500 for women.
Last year’s IFS/Nuffield Foundation report concluded that the performance of Creative Arts graduates across the earnings distribution was “roughly typical of non-graduates”, and this claim was corroborated by December’s LEO data. When analysing the 2002-03 graduate cohort in 2014-15, LEO shows that the median Creative Arts salary was £25,500 for men and £22,500 for women. The figures for the 2008-09 cohort five years out of university – the focus of Tuesday’s release – show both medians to be close to £20,000 per annum. More concerning, the lower quartile for men and women is below £15,000, meaning that a quarter of graduates in employment are south of that line. Another benchmark to consider here is the £21,000 repayment threshold for post-2012 student loans; the Treasury is paying a direct subsidy to graduates earning beneath that.
These findings echo some of what we already know. A degree boosts everyone’s prospects for being employed (the IFS noted that 20% to 30% of non-graduates have no recorded income, compared to 15% of graduates). Women on average get a significant increase in earnings from having a degree, but the choice of degree matters and for men that choice can sometimes leave individuals with a negative return from higher education (full-time study takes the individual out of the labour market for a period and those earnings lost are not made up by higher earnings in future years).

Creative Arts and self-employment
The absence of self-employment data from LEO has a huge impact on institutional comparisons. Conservatoires and small institutions specialising in training performers in music, acting and dance graduate earnings are hit by that absence. Some graduates who are included will have only a small PAYE income, indicating that the bulk of their earnings are coming through other means. Furthermore, 10% of Creative Arts graduates are identified as only earning through self-assessment and so are absent from the data.
Adding in these figures would likely leave Creative Arts and Design with a very flat distribution of median earnings by each institution, once small courses at Russell Group universities are excluded.
The accompanying notes to LEO indicate that the 2014-15 tax year is the benchmark year since self-assessment data is available and that the team is working with DWP and HMRC to incorporate it. While this is likely to give a significant lift to many of the institutions already mentioned, one needs to caution against any expectation of rises to the overall subject medians. Why? Well, the IFS report did include self-employment income, its ten-year figures were close to LEO’s five-year figures: putting the median earnings for men and women at £20,000 in 2012/13.
Even allowing for recent wage increases, this suggests that incorporating those Creative Arts graduates who are solely self-employed may not move the averages markedly and may even apply some downwards pressure. This is backed up by a recent Resolution Foundation presentation on self-employment, which showed freelancers in the arts, education and design sectors drawing down under £20,000 per year despite the high incidence of degrees amongst those workers. (The size of the circles in the chart below indicates the relative size of each sector in terms of freelancers.)
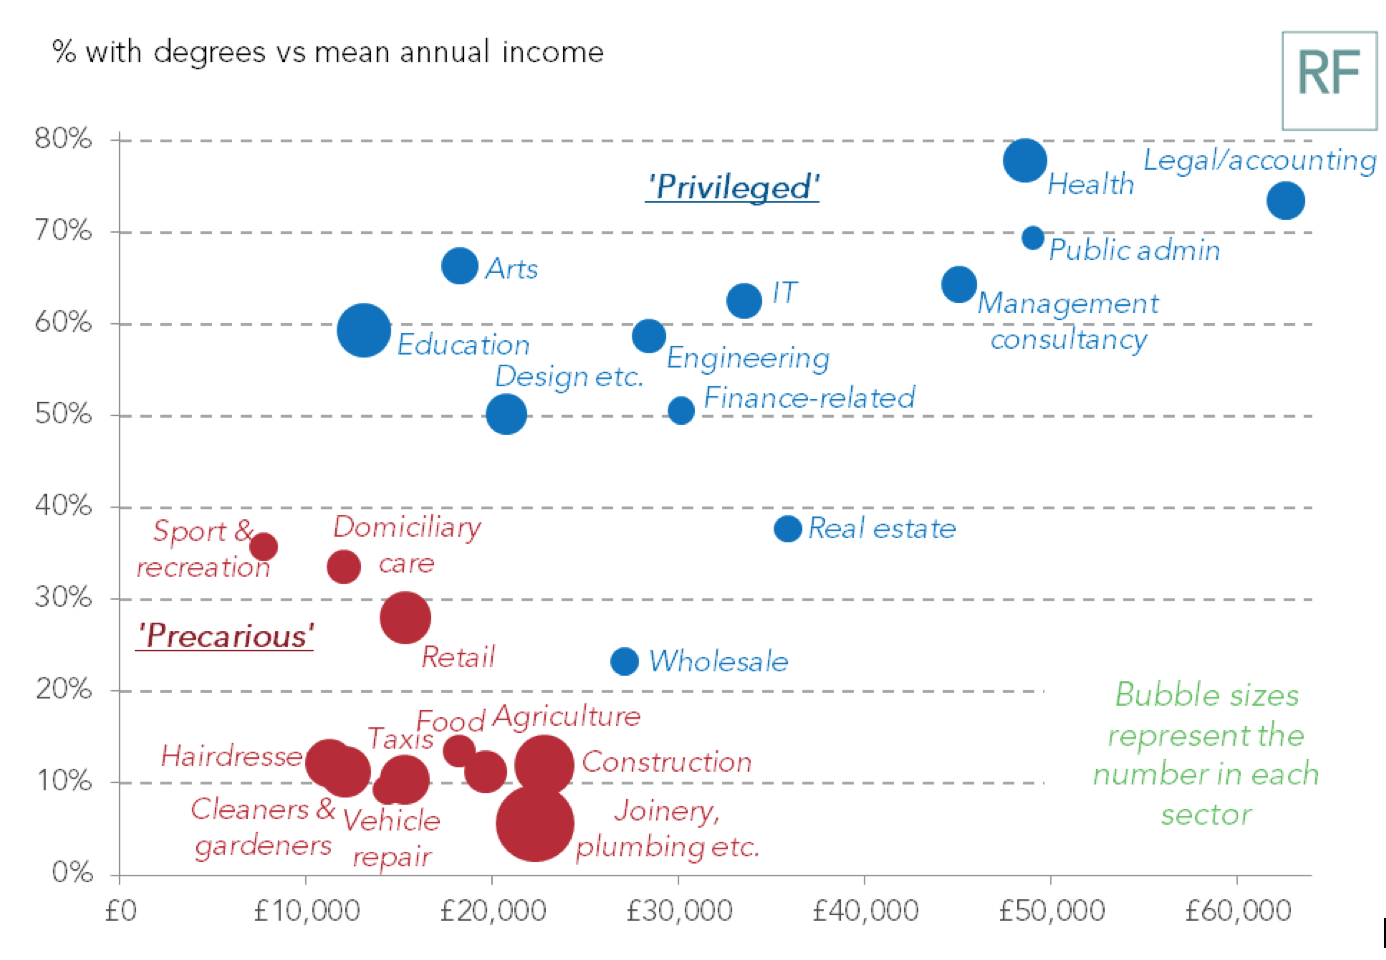
Source – Resolution Foundation
So while the inclusion of self-employment is necessary to get a better sense of any institutional comparisons, but, contrary to what we suggested on Wonkhe in December, it may not improve the overall median for the subject grouping.
More trouble
From a social mobility perspective (though not the only one), there is a further issue. If we compare Computer Science graduates to Creative Arts on prior attainment, the problem is clear. Both have high proportions of students from “Below 240” and “Not matched”, where the scores indicate the best 3 A-levels (as UCAS points) achieved by the graduate as captured by the National Pupil Database. (Records here do not go back to 2002/03, so these comparisons are for the 2008/09 cohort only and explain why there is no ten-year data broken down by institution. BTECs are not included.)
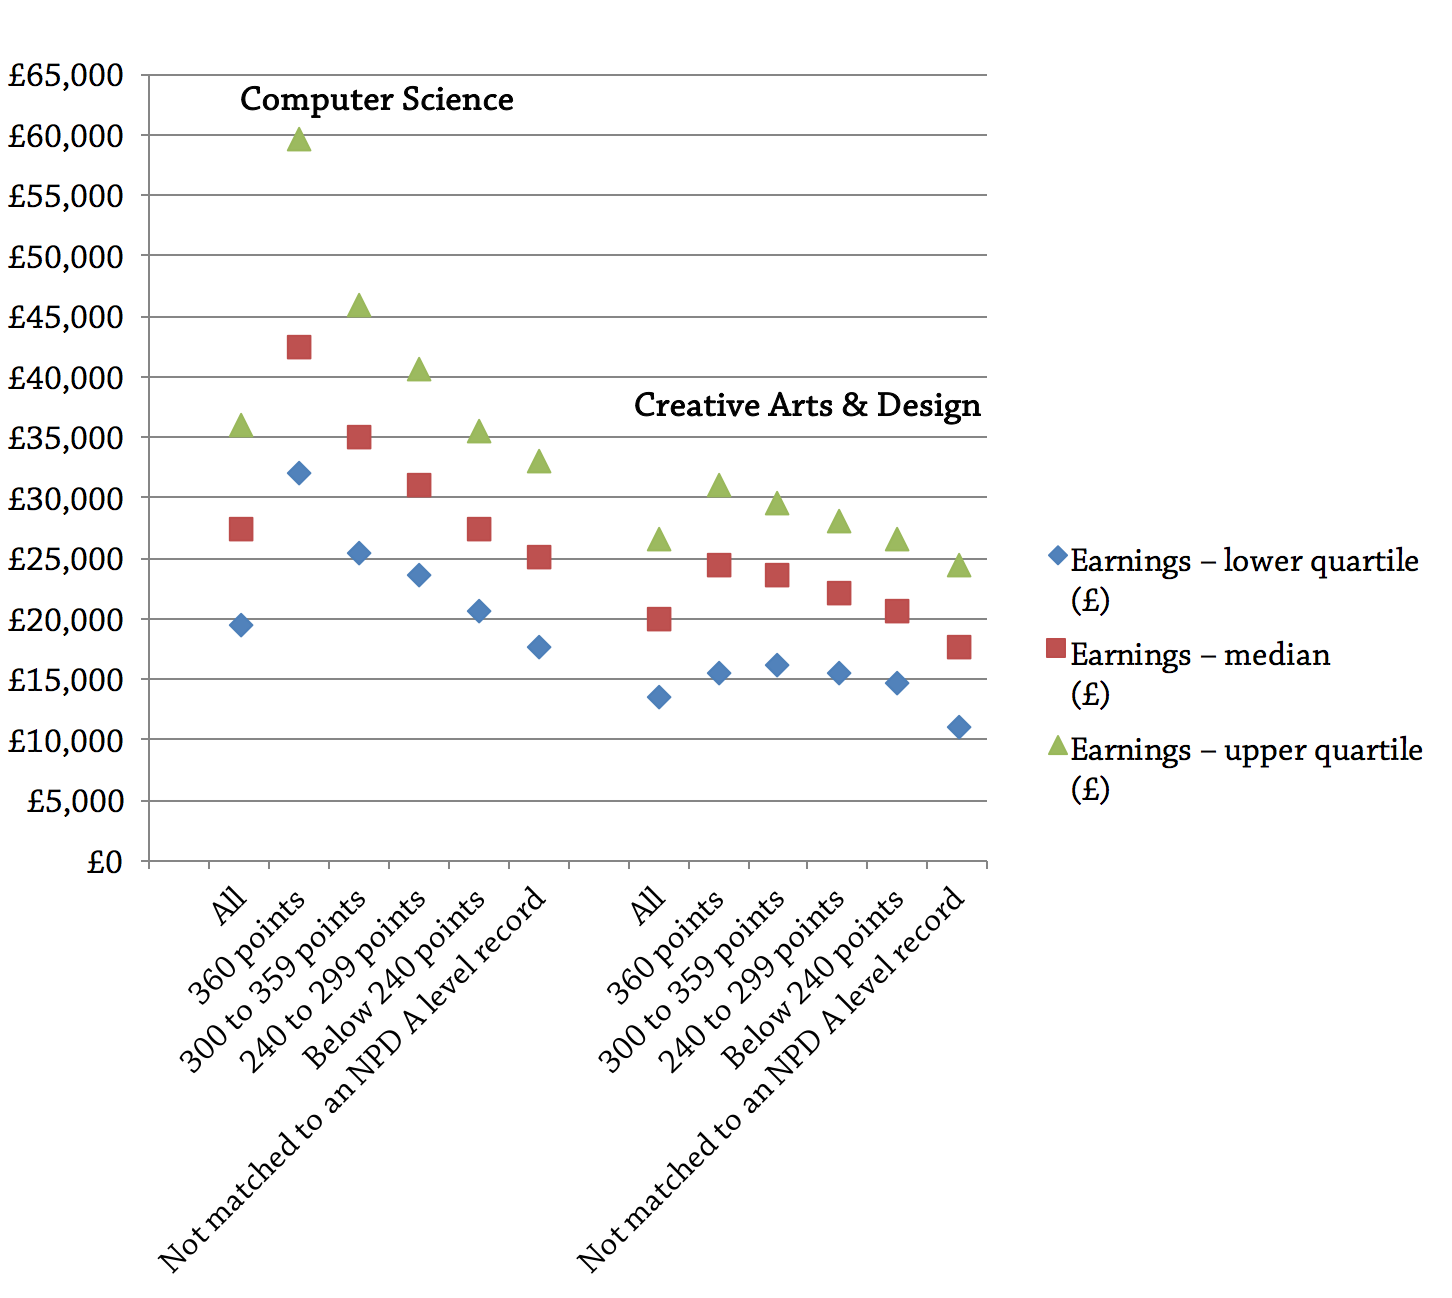
In fact, Computer Science has over 80% of its 6,500 matched graduates in these two categories as compared to 65% of the 16,800 in Creative Arts.
Were Creative Arts a small aggregate that would be one thing, but in the matched LEO data on earnings, they represent 10% of all students captured (and with the inclusion of self-employment data would be larger still). There are nearly four times as many Creative Arts graduates as those from Mass Communication or ‘Combined’ courses, and twelve times more than in Agriculture (to cite the other low earners).
A minister could reasonably reject instrumental philistinism in favour of ‘art for art’s sake’, frequent the major cultural institutions, promote the design-led industries, champion the contribution to cultural life and the gaiety of the nation, and still query whether England should allow higher education institutions to enrol tens of thousands of Creative Arts students each year on the current funding model. No current narrative that I can see coming from this part of the sector could rebut it.
Figures released on Thursday by the Student Loans Company showed that £8.234 billion was lent in undergraduate tuition fee loans to English-domiciled students and EU students studying at English HEI’s. With the uncapping of recruitment, there is no obvious way now (besides Brexit and trust in changing demographics) to control this outlay. As the political winds shift in England, there will be an increasing interest in how to limit that potential exposure. Further expansion in Creative Arts subjects would strain the political calculation that lay behind uncapping student numbers.
The more the government approaches higher education like an investor seeking a return, or a macroeconomic planner looking for national productivity boosts, the more this LEO data comes to the fore. There have already been calls from the political ranks for parts of higher education to be moved into further education streams: design and the creative arts stick out here.
Lobbying strategies need to do more than point to the size of the creative industries, since those £80 billion figures bandied about include software design, advertising and a range of large cultural organisations that do not predominantly fill their posts with Creative Arts graduates. In this light, the promised Institutes of Technology, revamped in the Conservative manifesto so as to have full degree awarding powers, would likely be making a straight pitch to recruit at the expense of regional specialists and large, non-specialists offering Creative Arts, some of which may be scoring Gold in the new TEF while languishing in the institutional earnings tables.
This may be a series of blunt points, but LEO is blunt.
No one was unaware that studying Fine Art is likely to lead to careers with lower earnings than are opened up by Economics, but the raw data makes it all too real, and will likely be pored over by applicants as well as wonks. For all the concerns with LEO, it does capture something about how internships and the gig economy are tarnishing the creative professions.
Too big (or too small) to ignore
Efforts to push the LEO data further hit the problem identified by Mike Picken in a comment on this site that Creative Arts and Design covers a wide-range of subjects. Some more closely resemble humanities degrees, and others are more focused on performance, production and practice. On the basis of the other subject figures, we would expect Creative Arts and Design courses oriented to the technical professions and those closer to the humanities to be pulling up the averages. In future iterations of LEO, it makes sense to disaggregate these subjects similarly to the separation of Psychology, Nursing and Economics from Biological Sciences, Subjects Allied to Medicine and Social Sciences respectively. Intuitively, it would make sense to separate off Design Studies (around a third of all Creative Arts and Design students) and performance-focused courses from the others, while also investigating the possibility of shifting courses closer to the Humanities into English and Historical and Philosophical Studies.
Such detail is no substitute though for an independent review. I am worried that we may lose vital national and local provision for want of analysis that identifies strengths accurately and is frank about where work and change is needed.
The LEO indicator light is blinking to tell us that there is a problem, but it will require some courage to lift the hood. LEO needs to be corralled and directed productively, away from crude interpretations and the simplistic reading I have sketched above. The alternative is that a stroke of an administrative pen or swings in demand could leave the Creative Arts – and all of us – with a diminished future.


Excellent analysis.
This is a big issue; we’ve been fudging the place of creative arts in HE for years. We’ll see what the Government has in mind for a review of tertiary education, but it would be worth OfS setting up a review at the very least.
This is a broad area; one aspect is the way the old cost centre system mapped on here. The breadth from a humanities type model to a very techie model could be seen in allocations across the B, C and D price groups. I wonder how the cost differentials that HEFCE used to fund have fared under the £9k system – another issue for higher cost specialist provision in multi-subject universities. Does acting – on a conservatoire model – get the same funding as Drama Studies through resource allocation models?
LEO didn’t get much attention last week, but we’ll need a sensible discussion if we are to avoid ROI drive too much of our education system.
Good, candid article, Andy.
But we do have to acknowledge that the situation becomes even more complex once we consider that parts of our crucial arts industries actually have graduate recruitment and retention issues – and these are often linked to their inability or unwillingness to offer competitive salaries. So that feeds into lower salary offer for graduates who do enter these roles.
Parts of this are therefore linked in not just to the place of the creative arts in HE but also in terms of the entire economy of the creative industries and to what extent we as a society are happy for those precarious economics to continue. What could easily happen is that we make it even harder for these small or niche employers to recruit and inadvertently damage the whole sector if this data and the accompanying complex questions it raises is not examined in a thorough and measured way.
tag:twitter.com,2013:885475181434724352_favorited_by_424296291
Joanne Tatham ☀️
https://twitter.com/Wonkhe/status/885475181434724352#favorited-by-424296291
tag:twitter.com,2013:885475181434724352_favorited_by_297670835
Ruth Arnold
https://twitter.com/Wonkhe/status/885475181434724352#favorited-by-297670835