Developing a new official statistic is a process that can span several years.
Work on SEISA began in 2020 and this blog outlines the journey to official statistics designation and some key findings that have emerged along the way. Let’s firstly recap why HESA needed a new deprivation index.
The rationale behind pursuing this project stemmed from an Office for Statistics Regulation (OSR) report which noted that post-16 education statistics lacked a UK-wide deprivation metric. Under the Code of Practice for Statistics, HESA are required to innovate and fill identified statistical gaps that align with our area of specialism.
Fast forward almost six years and the UK Statistics Authority have reiterated the importance of UK-wide comparable statistics in their response to the 2024 Lievesley Review.
Breaking down barriers
While higher education policy may be devolved, all nations have ambitions to ensure there is equal opportunity for all. Policymakers and the higher education sector agree that universities have a pivotal role in breaking down barriers to opportunity and that relevant data is needed to meet this mission. Having UK-wide comparable statistics relating to deprivation based on SEISA can provide the empirical evidence required to understand where progress is being made and for this to be used across the four nations to share best practice.
In developing SEISA, we referred to OSR guidance to produce research that examines the full value of a new statistic before it is classed as an ‘official statistic in development’. We published a series of working papers in 2021 and 2022, with the latter including comparisons to the Indices of Deprivation (the main area-based measure utilised among policymakers at present). We also illustrated why area-based measures remain useful in activities designed to promote equal opportunity.
Our research indicated that the final indexes derived from the Indices of Deprivation in each nation were effective at catching deprived localities in large urban areas, such as London and Glasgow, but that SEISA added value by picking up deprivation in towns and cities outside of these major conurbations. This included places located within former mining, manufacturing and industrial communities across the UK, like Doncaster or the Black Country in the West Midlands, as well as Rhondda and Caerphilly in Wales. The examples below come from our interactive maps for SEISA using Census 2011 data.
An area of Doncaster that lies within decile 4 of the English Index of Multiple Deprivation (2019)
An area of Caerphilly that lies within decile 5 of the Welsh Index of Multiple Deprivation (2019)
We also observed that SEISA tended to capture a greater proportion of rural areas in the bottom quintile when compared with the equivalent quintile of the Index of Multiple Deprivation in each nation.
Furthermore, in Scotland, the bottom quintile of the Scottish Index of Multiple Deprivation does not contain any locations in the Scottish islands, whereas the lowest quintile of SEISA covers all council areas in the country. These points are highlighted by the examples below from rural Shropshire and the Shetland Islands, which also show the benefit that SEISA offers by being based on smaller areas (in terms of population size) than those used to form the Indices of Deprivation. That is, drawing upon a smaller geographic domain enables pockets of deprivation to be identified that are otherwise surrounded by less deprived neighbourhoods.
A rural area of Shropshire that is placed in decile 5 of the English Index of Multiple Deprivation (2019)
An area of the Shetland Islands that is within decile 7 of the Scottish Index of Multiple Deprivation (2020)
Becoming an official statistic
Alongside illustrating value, our initial research had to consider data quality and whether our measure correlated with deprivation as expected. Previous literature has highlighted how the likelihood of experiencing deprivation increases if you are a household that is;
- On a low income
- Lives in social housing
- A lone parent family
- In poor health
Examining how SEISA was associated with these variables gave us the assurance that it was ready to become an ‘official statistic in development’. As we noted when we announced our intention for the measure to be assigned this badge for up to two years, a key factor we needed to establish during this time period was the consistency in the findings (and hence methodological approach) when Census 2021-22 data became available in Autumn 2024.
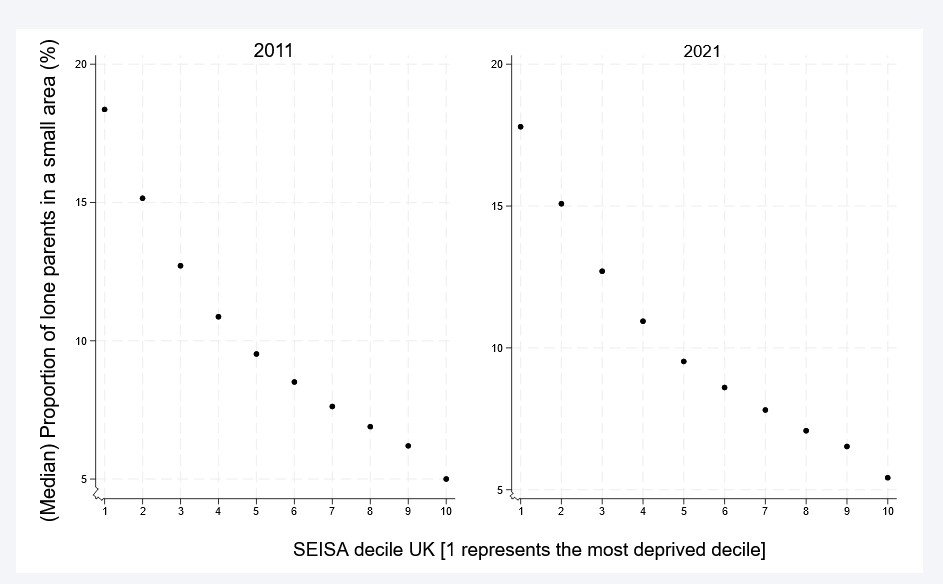
Recreating SEISA using the latest Census records across all nations, we found there was a high level of stability in the results between the 2011 and 2021-22 Census collections. For instance, our summary page shows the steadiness in the associations between SEISA and income, housing, family composition and health, with an example of this provided below.
The association between SEISA and family composition in Census 2011 and 2021-22

Over the past twelve months, we’ve been gratified to see applications of SEISA in the higher education sector and beyond. We’ve had feedback on how practitioners are using SEISA to support their widening participation activities in higher education and interest from councils working on equality of opportunity in early years education. The measure is now available via the Local Insight database used by local government and charities to source data for their work.
It’s evident therefore that SEISA has the potential to help break down barriers to opportunity across the UK and is already being deployed by data users to support their activities. The demonstrable value of SEISA and its consistency following the update to Census 2021-22 data mean that we can now remove the ‘in development’ badge and label SEISA as an official statistic.
View the data for SEISA based on the Census 2021-22 collection, alongside a more detailed insight into why SEISA is now an official statistic, on the HESA website.
Please feel free to submit any feedback you have on SEISA to official.statistics@hesa.ac.uk.
Read HESA’s latest research releases and if you would like to be kept updated on future publications, you can sign-up to our mailing list.


