If you work at a UK university you won’t need telling that we are in the middle of NSS season.
It started a few weeks ago, perhaps with a well-publicised university launch, or at the very least with the appearance of posters exhorting students to complete the survey online, often accompanied by inducements to do so.
Can’t get no satisfaction
There is simply no denying the importance of the NSS. But really, what can any of us do to improve student satisfaction? Having analysed the NSS results for the 100 largest universities that participated in the NSS every year over the last decade (2007-2016), we can offer the following advice. First, some good news.
The university you work at, and the subject area you teach, are not the most important things to worry about as far as the NSS is concerned. In fact, the university attended accounts for only 9% of the total variation in NSS scores which, modest though it is, is still twice as important as the subject studied, which accounts for a mere 4% of the variation.
By far the most important factor is the NSS questionnaire itself, with variation across the 22 items (groups of questions) accounting for around 40% of the total variation in outcome, dwarfing the role of all other factors. This is simply a reflection of the fact that the NSS samples across a broad range of domains of student satisfaction, and the profile of responses has been remarkably consistent over the last decade.
Can get some satisfaction … eventually
But, returning to the question of how to improve your performance on the NSS, the simple answer is to change the NSS items to ones that best suit your university or subject group.
You may think that there is little you or anyone else can do about what the NSS items are. But, as we have seen in recent times, the NSS items are not fixed in stone and can be altered by lobbying. Naturally, the focus of your lobbying should depend upon the type of institution you work at. If you are from a research-led university, items about exposure to cutting edge-research might be your thing. If you are from a teaching-focused university, you should probably lobby for an item on contact hours.
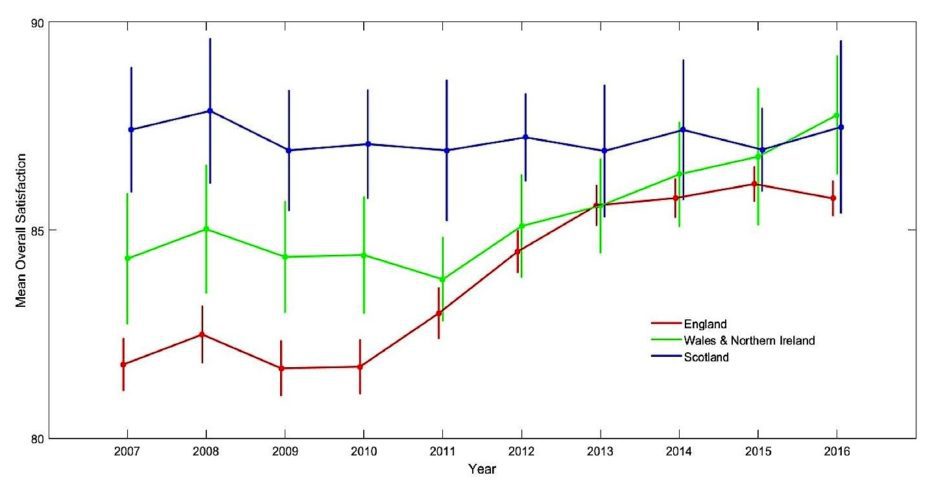
One thing that you almost certainly won’t be pressing for is an item about value for money. The NSS, in its current form, ignores what is probably the greatest source of student dissatisfaction with higher education – the cost. In fact, over the last ten years the NSS has completely failed to track changes in satisfaction related to costs. This is clearly shown by the changing differences in satisfaction between students hailing from the four home nations. In 2007, Scottish students reported substantially higher rates of overall satisfaction (87.4%) than students from England (81.8%).
The introduction of full-cost tuition fees in England in 2012, far from exacerbating this difference, actually saw the gap close, with English students becoming increasingly satisfied over the decade. Students from Wales and Northern Ireland, who started the decade with satisfaction rates somewhere between the English and Scots, also showed improved satisfaction, so that currently all four home nations are largely on par with each other.
Figure 1: Mean ‘overall satisfaction’ for the devolved national undergraduate cohorts

England = high tuition fees; Wales and Northern Ireland Intermediate tuition fees; Scotland. free tuition fees). Error bars indicate ±1 standard errors from the mean. Tuition fees were payable throughout the period (except in Scotland) and were increased in 2012, affecting the NSS cohort for the first time in 2015. Source: Authors’ analysis
We can’t say whether this seemingly perverse response to the tripling of tuition fees in England shows that higher education has become a Veblen good (“My education is really expensive so it must be really good”), or is a case of mass collective cognitive dissonance (“I paid a lot for it so I must really value it”), or is due to something else. More probably, the NSS failed to track changes in satisfaction related to cost because it didn’t ask about it. But, the issue won’t simply go away by ignoring it, and it might be better for all concerned to honestly address a core area of student dissatisfaction by adding an item on value for money to the NSS. It remains to be seen what the OfS’s first bit of commissioned research, using Trendence’s panel, reveals on the matter.
Lobbying to change the NSS might reap massive benefits for your university’s NSS scores, but it’s playing a long game without any certainty of success. So, if you want to see improvements in your institutions’ NSS score before you retire, here are some quick gains.
Can get some satisfaction … quickly
First, although we said that the university is relatively unimportant, there have been some fairly consistent differences between universities over the past decade, with members of the Russell Group and the now-defunct 1994 group clustering towards the top of the table, and ‘newer’ Million+ members towards the bottom. University Alliance institutions were too widely distributed to characterise. So, if you want to work in a subject group with good NSS results, changing university seems like a fairly safe bet.
However, this may not be quite as simple as it seems. It turns out that differences between universities are partly due to the subjects they teach. Universities focussing on clinical studies (medicine, dentistry, veterinary science etc.) and the physical and biological sciences, tend to do better than those focussing on creative disciplines (music, drama, creative arts etc.) and social studies (social work, media studies, teacher training etc.). So, you may find that changing university is not enough; you may need to change discipline as well.
Let’s imagine that the NSS results are so important to you that you decide to jump ship to work at another institution, which one do you choose? In the sample of 100 of the UK’s largest universities, we found that the average difference between the highest and lowest ranking, in the 10-year period from 2007 to 2016, was 39 places, a seemingly astonishing degree of inconsistency. In addition, the average difference was much greater for those universities near the middle of the table than for those near the top or bottom. So, the problem for you is that even if you do change university, NSS rankings are so variable that there’s no guarantee you’ll do any better by moving.
A more practical way to improve NSS ratings at your university is to encourage as many students as possible to complete it. It has long been known that there is a small correlation between the NSS response rate and course satisfaction, so it should come as little surprise that most universities do what they can to encourage their students to get online and complete the survey. It should not need pointing out, however, that correlation does not imply causation – but, hope springs eternal, and most universities act as though they have a vast pool of highly-satisfied students simply awaiting the right nudge in order to sing their praises in the NSS.
Maybe that is true but, there is a potential danger here. The correlation between NSS scores and response rate, already weak, has declined over the last decade. It is likely that both highly satisfied and highly dissatisfied students are strongly motivated to complete the NSS, and will do so without much intervention. Relatively content students, who seem to be the large majority, may need a little nudge to do the deed and – historically – it seems they have been more likely to do so than their mildly-discontented counterparts. By pressing too hard for ever-increasing response rates, we risk encouraging more of the dissatisfied to respond, and this may be why the correlation between response rate and satisfaction has declined over time.
Playing the game
Undoubtedly, your university’s primary goal will be to get the highest possible ranking it can on publically available league tables, such as that published by The Times and The Guardian. Inevitably, and unreasonably, their focus falls upon item 22: “Overall, I am satisfied with the quality of the course”. For this reason, it’s well worth asking what the best predictors of overall satisfaction are.
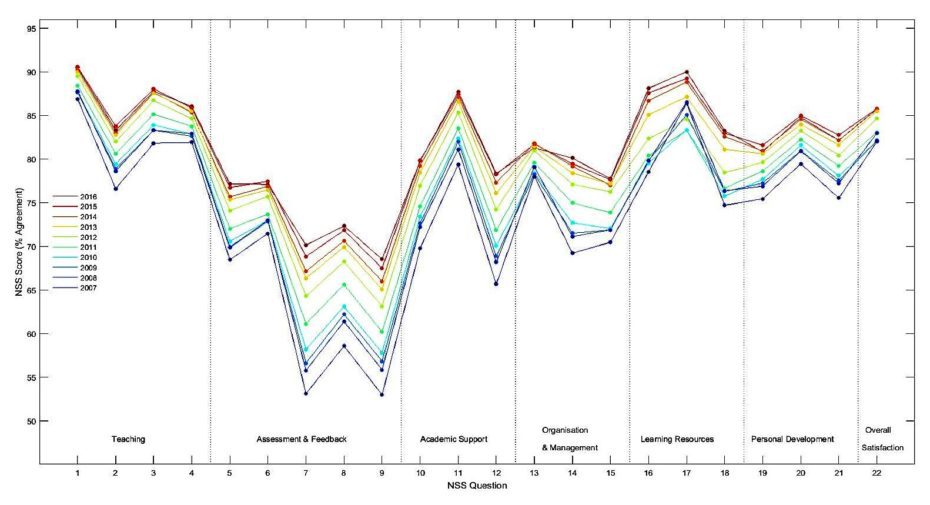
You might think, for example, that the best way to improve overall satisfaction would be to focus on those items where your subject group fared worst. In most cases, this will be on the items in the ‘assessment and feedback’ subscale, and it seems that this has been the approach taken by most universities. However, a decade of focussed effort in this area, producing substantial and objectively demonstrable improvements in performance, has brought relatively modest rewards in terms of student satisfaction. Whilst it is true that ‘assessment and feedback’ have shown the greatest improvement over the decade, it remains the area with the lowest levels of satisfaction.
Figure 2: Mean UK student satisfaction, measured using the NSS from 2007 to 2016 (averaged over items 1 to 22)

Source: Authors’ analysis
Back to basics
In our review of NSS we found that the strongest predictor of ‘overall satisfaction’ was ‘organisation and management’ closely followed by ‘teaching quality’. The other subscales, ‘assessment and feedback’, ‘academic support’, ‘learning resources’ and ‘personal development’, were very much less important. So, the university’s recent investment in that prestigious multi-million-pound learning centre, useful as it is in attracting students and showing-off to visiting dignitaries, probably has only a modest impact on your NSS scores.
In summary, what we believe will be most effective, is to teach our students well, and to ensure that our courses are well-organised. This involves teaching to the best of our ability, supporting our colleagues in their teaching, and doing what we can to get our universities to provide us with adequate administrative support. Not glamorous, not likely to inspire the hero-innovator in our souls, but it is advice that has the virtue of being supported by the evidence. Get the basics right, and the gains will follow.
This article is based on a research report by Adrian Burgess and Elisabeth Moores (Department of Psychology, Aston University), and Carl Senior (Department of Psychology, Aston University and University of Gibraltar).


Interesting article but it’s not true that league tables only look at the overall satisfaction question. And it doesn’t influence the TEF at all. It’s university governors / lay members of council who tend to obsess over it.
Fair comment – I may have overstated the case for the importance of overall satsifaction to league tables but my experience suggests that it is still considered to be a very important metric within universities. After all, the views of governors/lay members of council do carry significant weight