Imagine picking up your favourite newspaper one morning and suddenly not being able to understand what had been written, though you had the day before. Maybe the odd word was the same or seemed familiar, but the rest was gibberish. It would be a bit unnerving and a challenge to the normal order of things.
That’s what you could find if you pick up a copy of a university’s 2015/16 financial reports. The introduction of new accounting rules means that there are significant changes to the way university finances are measured and recorded. It’s the biggest change in university accounting for twenty years.
We should set one thing straight at the outset: the absolute financial performance of a university or the real value of its assets isn’t different, but the way in which the numbers are represented – and reported – in the financial statements have changed significantly. If you haven’t kept up with the ins-and-outs of the reporting changes, now is the time to learn if you want to get your head around the new format.
Why the change?
For over a decade the UK accounting standards setting body – the Financial Reporting Council (FRC) – has been on a mission to harmonise the country’s accounting standards with international norms. This was completed in 2015, with the replacement of forty different standards (over 2,000 pages in total) with a new code based on a single, internationally-consistent reporting framework just 250 pages long.
In December 2016, universities published their 2015/16 financial results; those for the financial year ending 31 July 2016. These are the first to report under the new accounting standard – known snappily as FRS102 – interpreted for the sector by the FE & HE Statement of Recommended Practice (SORP).
What will the financial statements look like?
The new accounting code changes the way some income, expenses, assets, and liabilities appear on the financial statements. This includes, for example, the way pension liabilities appear. In the past, a deficit in the Universities Superannuation Scheme (USS) pension liability would have appeared as a separate note with no effect on the reported figures. Now, the liability is ‘on balance sheet’, which could show a reduced surplus or even loss for the year versus the old accounting rules.
Financial statements always show the prior year’s financial results next to the current year’s, so that performance can be judged from year-to-year. To make things clearer, last year’s results (2014/15) that appear in this year’s (2015/16) financial statements have been re-stated under the new rules. This enables readers to make a like-for-like comparison and assess relative performance more accurately.
The other advantage of doing this is that it enables readers to take the 2014/15 figures from last year’s accounts (under the old accounting standard), and put them side-by-side with the same (14/15) figures in this year’s accounts (under FRS102 – the new accounting standard). When we do this, we see the surprising impact the new accounting rules can have.
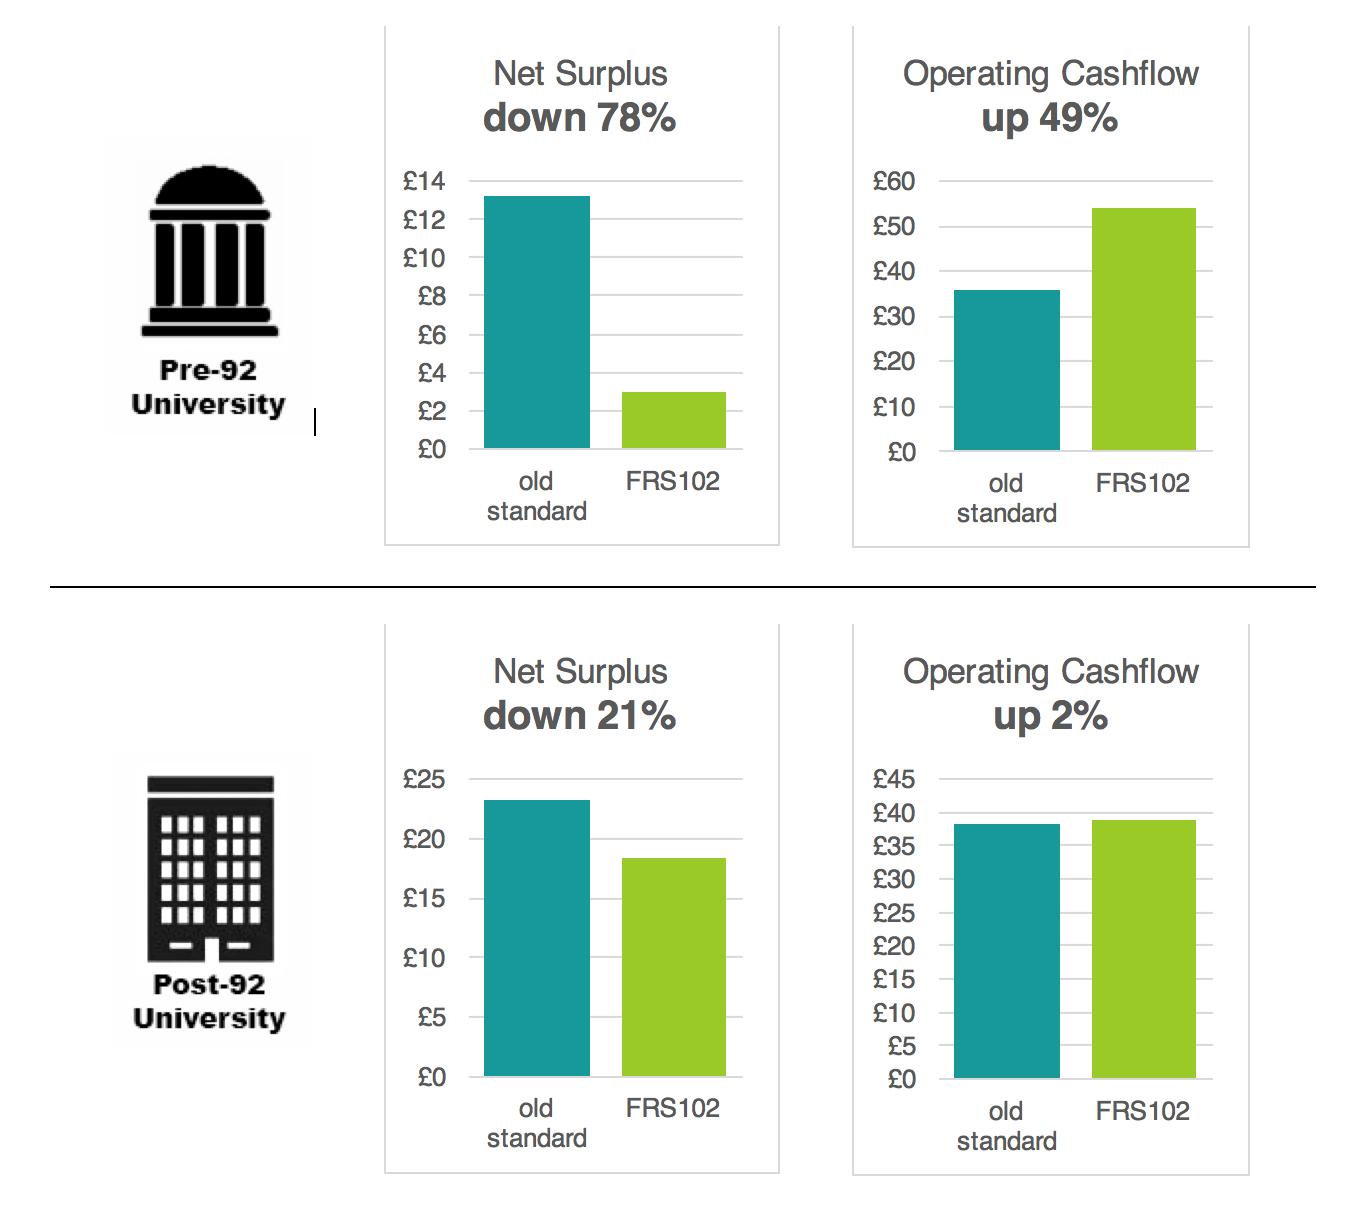
The charts below use figures taken from the last two years’ accounts at two real universities, one a pre-92 university and one post-92, to show how their reported (annual) financial performance, using two different measures, has changed under the new standard. All figures are in £millions.

What does this tell us? In both the pre- and post-92 HEIs, net surplus was down (78% and 21%) under FRS102, but operating cash flow was up. Both net surplus and operating cash flow are used to measure a university’s financial performance – they measure it in different ways and are both important.
Notice that there were much bigger swings in both of these measures in the older pre-92 university, compared to the post-92 university. We shouldn’t necessarily expect these swings to be repeated every year, or to be typical of the results similar universities report in 2015/16. That’s another quirk of the new accounting rules – there is likely to be increased volatility in the results from one year to the next.
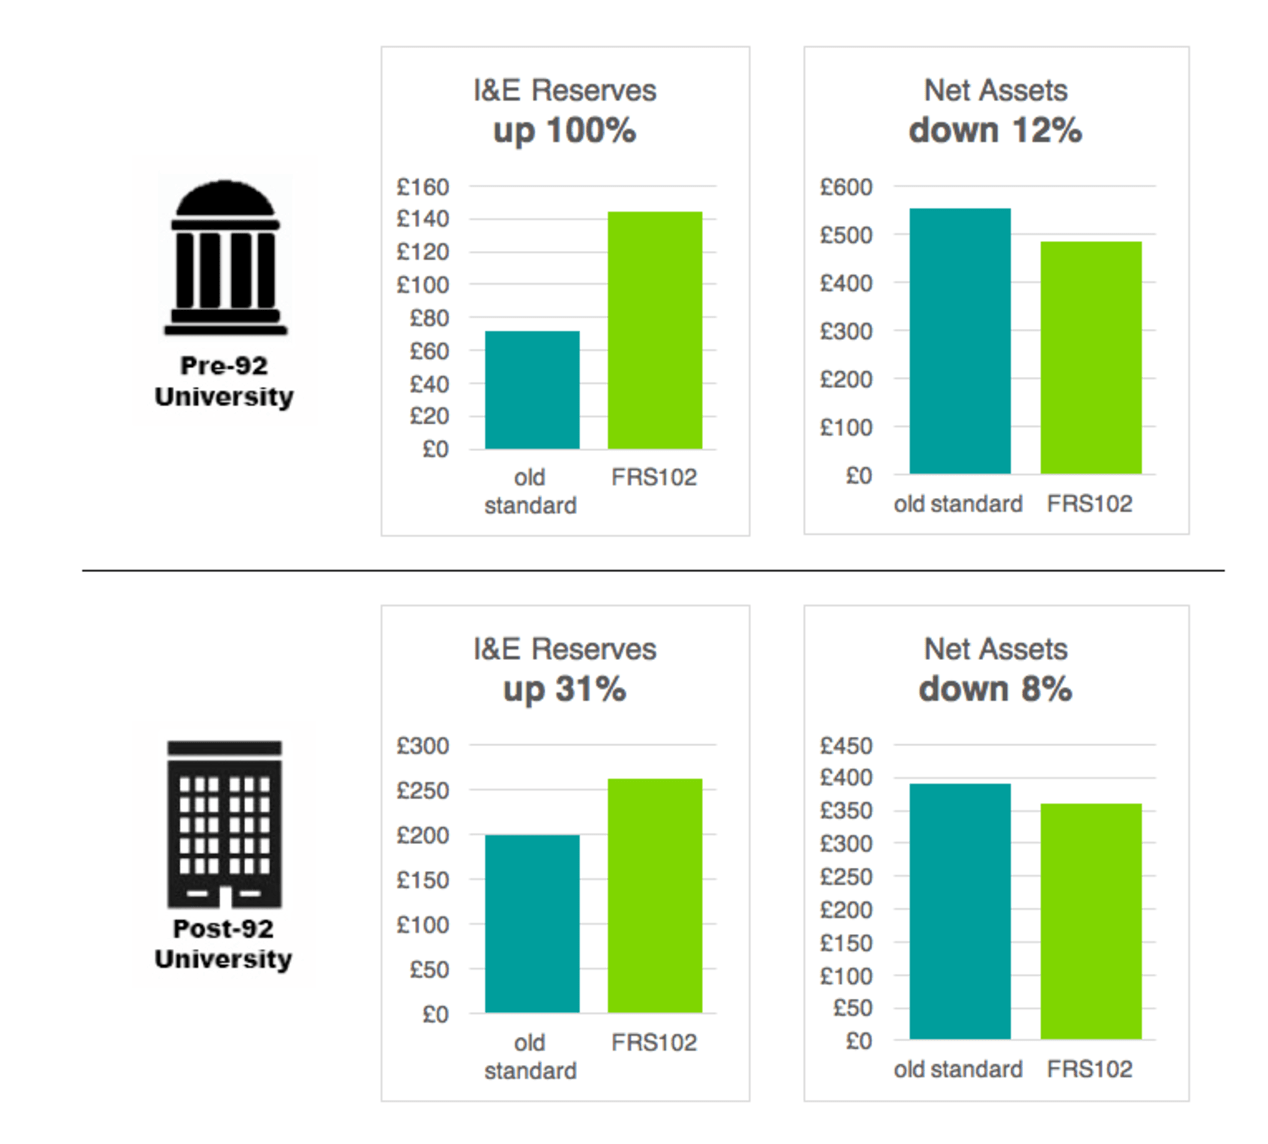
Now let’s look at two of the figures that are used to measure an organisation’s financial strength. Again, all figures are in £millions.

Once again it’s a mixed picture, with Income and Expenditure reserves (liquid assets like cash) up, but net assets (including buildings etc.) down. And once again there are bigger swings in the pre-92 HEI, with a 100% increase in its I&E Reserves (improving its reported financial strength), but a fall in net assets by 12% (reducing its financial strength).
How do we make sense of the changes?
There are lots of reasons why measures of a university’s financial performance might be different this year under FRS102 than they were under the old rules. On top of the treatment of USS pension liabilities mentioned in the example above, there are changes to the way grant funding for research is recorded, as well as how universities measure the value of their buildings and estates, and many other things. And to add complexity, universities have choices about when and how the report some items; that will mean that reading across multiple universities’ accounts for comparisons is particularly tricky.
To get the full picture, you may have to dig a bit deeper into the financial statements than you had done before. To help readers, universities have made extra effort to explain the most significant changes in their annual financial reports this year, and many will have included comparison tables showing figures under the old and new systems, or produced additional technical annexes that go into more detail. Some will also have explained the impact of the new standard on perceptions of the institution’s long-term financial sustainability, as one of the features of FRS102 is increased volatility in the numbers from one year to the next.
New accounting standards have brought new challenges and choices for universities. For the lay reader, FRS102 could add a level of complexity for the less-than-financially-minded, which makes it more difficult to understand, and to compare, institutional performance.
University financial statements are made publicly available on each institution’s website. A directory with links to most universities’ financial statements can also be found here.


