Students are working more than ever. Or are they?
Torsten Bell and Alan Milburn say fewer students are working. Jim Dickinson goes down the Labour Force Survey rabbit hole to find out why purpose-built surveys say the opposite
Comment|

Jim is an Associate Editor (SUs) at Wonkhe
Rabbit hole time!
Earlier this year, Torsten Bell (the pensions minister and former chief executive of the Resolution Foundation) told his followers that:
…despite what you hear about more uni students working these days, the opposite is true.
He was pointing at our old friend the Labour Force Survey (LFS), which suggests that about a third of full-time students are in work, a figure that has been flat or falling for years.
In June, HEPI and Advance HE published the 2026 Student Academic Experience Survey. It found that 65 per cent of full-time undergraduates are in paid employment during term time – up from under four in ten five years ago.
A third and two thirds can’t both be right. And when a minister at the heart of the government’s economic thinking picks one of them, it matters which is closer to reality.
It isn’t just Bell. Alan Milburn’s interim review of young people and work leans on the same survey – while DfE’s own Student Income and Expenditure Survey, sampled directly from university records, found the proportion of full-time students in paid work rose from 52 per cent in 2014/15 to 58 per cent in 2021/22.
When I first looked at this in February, I figured that the LFS was never designed to count working students – and having been down the data rabbit hole since, I think I’ve ID’d every reason the two surveys disagree. The figures below come from the January to March 2026 quarter, which lines up with the SAES fieldwork – but every finding holds across all four quarters.
The “third” isn’t about universities
The Labour Force Survey figure that produces “about a third” is the employment rate for every full-time student aged 16 and over – 32.9 per cent in the January to March quarter.
That includes around 870,000 sixth formers and college students studying for A-levels or T-levels, and another 336,000 working towards GCSEs, of whom just 9 per cent are in work.
The survey asks everyone what qualification they’re working towards, so it’s easy enough to pull out full-time students studying for a degree or another higher education qualification. Do that, and the employment rate for full-time undergraduates is 40.2 per cent – and about 40 to 45 per cent in every recent quarter.
That isn’t a flaw in the survey so much as a flaw in how it gets quoted – but it’s the difference between “a third” and “four in ten” before anyone looks at the horror of how the data is collected.
Students the survey can’t find
The Labour Force Survey samples private household addresses. Communal establishments – including university halls – aren’t on the list, because there’s a “lack of a suitable, comprehensive and readily available sampling frame”. ONS makes an effort to include students in halls anyway. The method?
adult children living in halls of residence will be included at the parental address.
If your parents’ house gets picked, you’re in. If it doesn’t, you aren’t. And the same rule catches private purpose-built student accommodation too.
Set the survey’s weighted estimates against HESA’s term-time accommodation data for 2024–25 and the problems are obvious. HESA counts around 1.79 million full-time undergraduates, and the LFS finds around 1.54 million – but the shortfall isn’t spread evenly. The survey finds around 263,000 undergraduates in halls against HESA’s 442,000, and around 577,000 in rented or other accommodation against HESA’s 954,000, while it finds 695,000 living with their parents against HESA’s 394,000.
For international students, the halls workaround doesn’t work at all – their parents don’t have a UK address. International students make up around a third of full-time students in halls and purpose-built accommodation, which implies roughly 190,000 of them that the LFS has no way of sampling. The few it does find are a small and unusual group, recorded as working at around a quarter – against 80 per cent in the SAES.
Students in shared houses are on the list, but surprise surprise, they rarely respond – and that points to the wider problem. Each quarter there’s between 1,000 and 1,300 full-time undergraduates in the sample, each standing in for about 1,200 real students – so every correction above is working with subgroups of a few dozen people.
The weighting doesn’t fix it
You might assume that the survey’s weighting corrects for all of this. Sadly not – nothing in it knows who is a student.
Responses are weighted to population estimates by local authority, age, and sex, which count students at their term-time address – but if the students in a university town aren’t in the sample, the weights simply get spread across the young people who did respond, who are disproportionately not students.
The undergraduate total is never checked against HESA, and the communal establishment population subtracted from the totals still uses proportions from the 2011 Census.
Who’s answering
The Labour Force Survey allows one member of a household to answer on behalf of another, and it even allows answers from a previous quarter to be carried forward when a household doesn’t respond.
For full-time undergraduates, only 29.5 per cent of the records are the student answering for themselves. Another 49.6 per cent are someone else in the household answering for them (usually a parent) and 20.9 per cent are the previous quarter’s answers carried forward.
For students in halls, yikes. Just 14 of the 236 undergraduates recorded as living in halls answered for themselves – and the rest are recorded as working at just 27 per cent.
It makes a difference – students answering for themselves report more work than those answered for by someone else, 44.9 per cent against 37.9 per cent. If your kid is two hours away and picking up the odd shift through an agency or an app, would you know whether they worked last week?
And carrying forward answers, the survey’s own user guide admits, depresses estimates of change – a problem if the question is whether student work is falling.
What’s being asked
The Labour Force Survey counts someone as employed if they did at least an hour of paid work in one specific reference week. The SAES asks how many hours students spend in paid employment “in an average week during term-time”. A student who works a shift every fortnight is in work on the second definition and only sometimes on the first.
The clearest evidence comes from comparing hours. In the LFS, around 10 per cent of full-time undergraduates are working between one and ten hours a week. In the SAES, it’s 29 per cent. At the other end – more than 20 hours – the two surveys roughly agree.
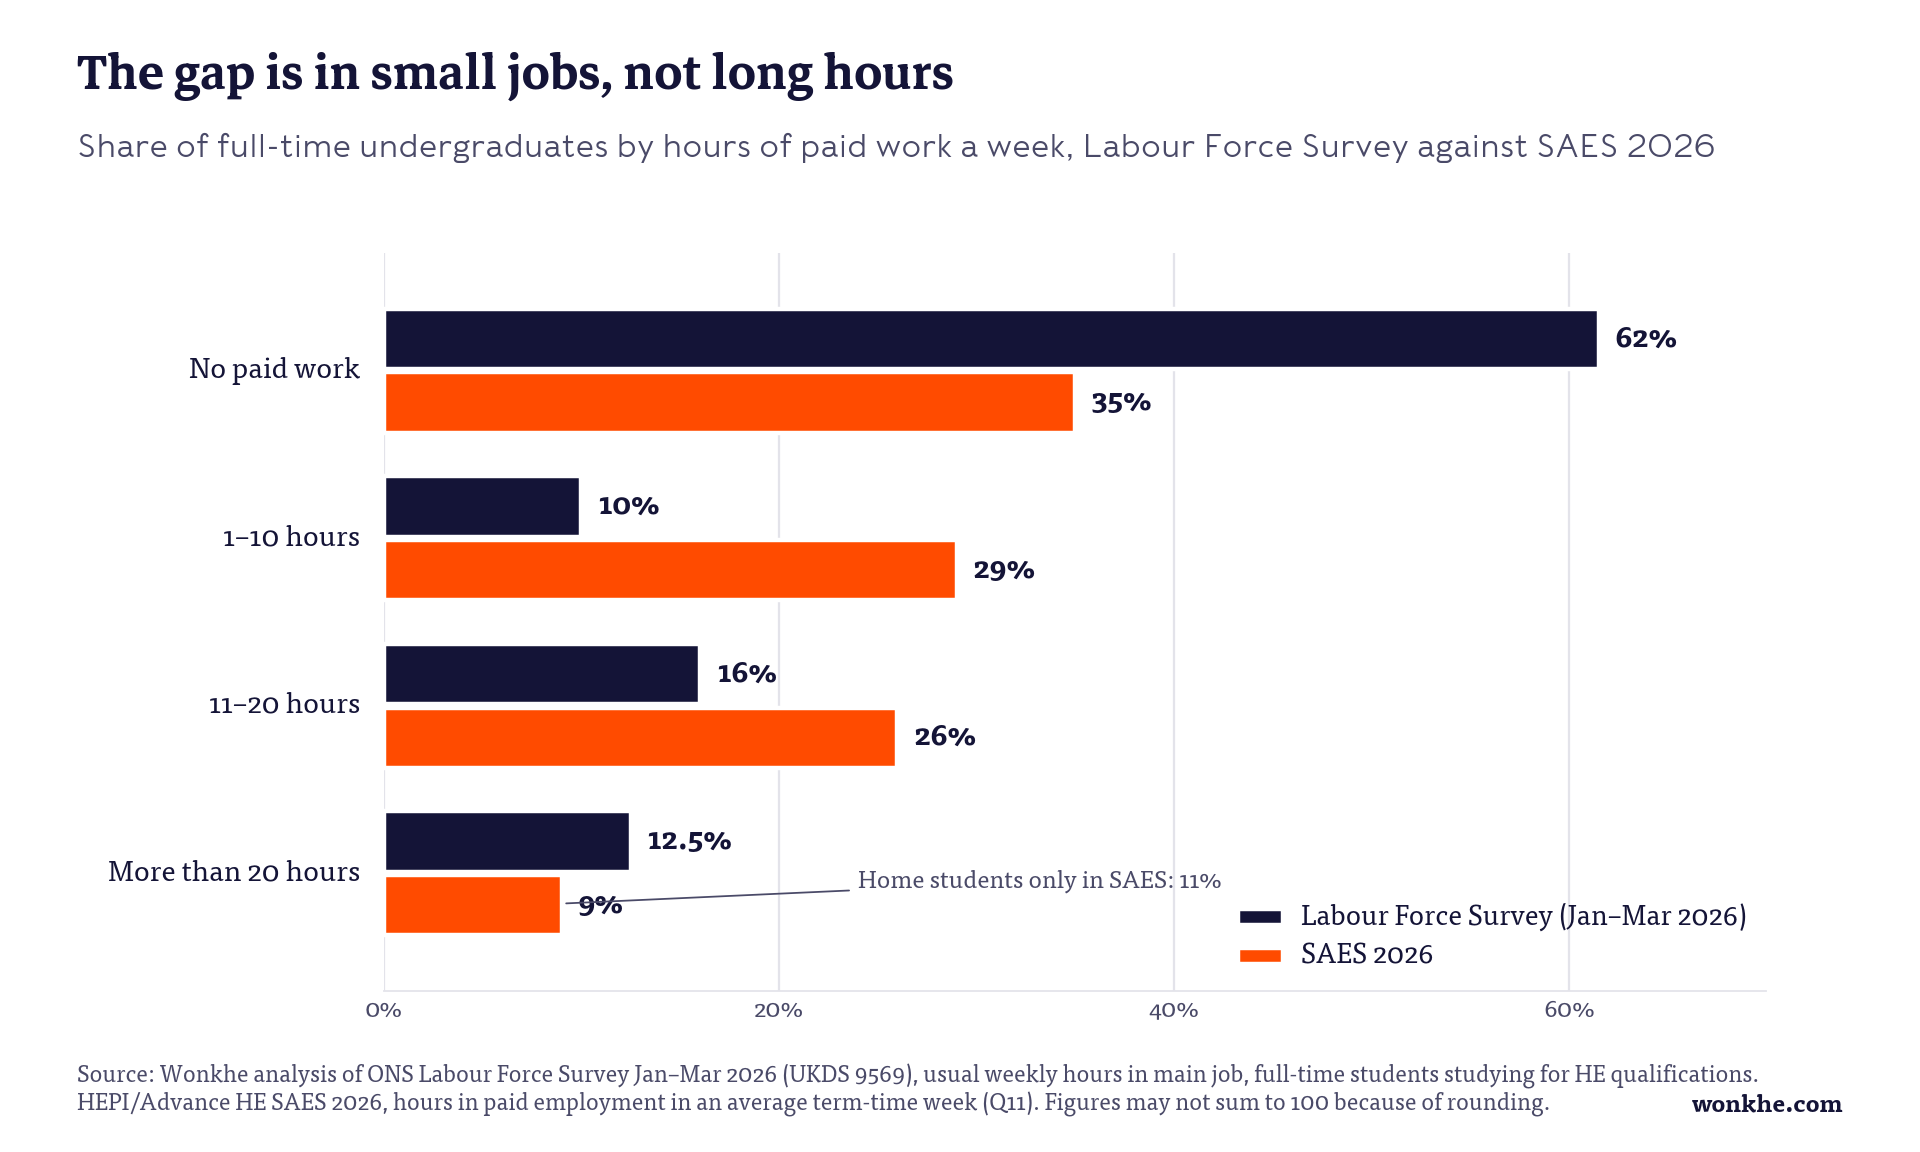
So the gap isn’t in students working long hours. It’s almost entirely in small, irregular jobs – the sort of work that a one-week snapshot, answered by a parent, is least likely to catch.
The wrong weeks
The January to March reference weeks take in the end of the Christmas break and, with Easter falling on 5 April this year, the start of many universities’ spring breaks.
Undergraduates whose reference week fell in January are recorded as working at 38.5 per cent, and in March at 38.0 per cent – but for February, the only month that is term time throughout, the figure is 44.5 per cent!
Putting it back together
Correct for each of these problems in turn, and the gap closes to the point where it’s within the noise.
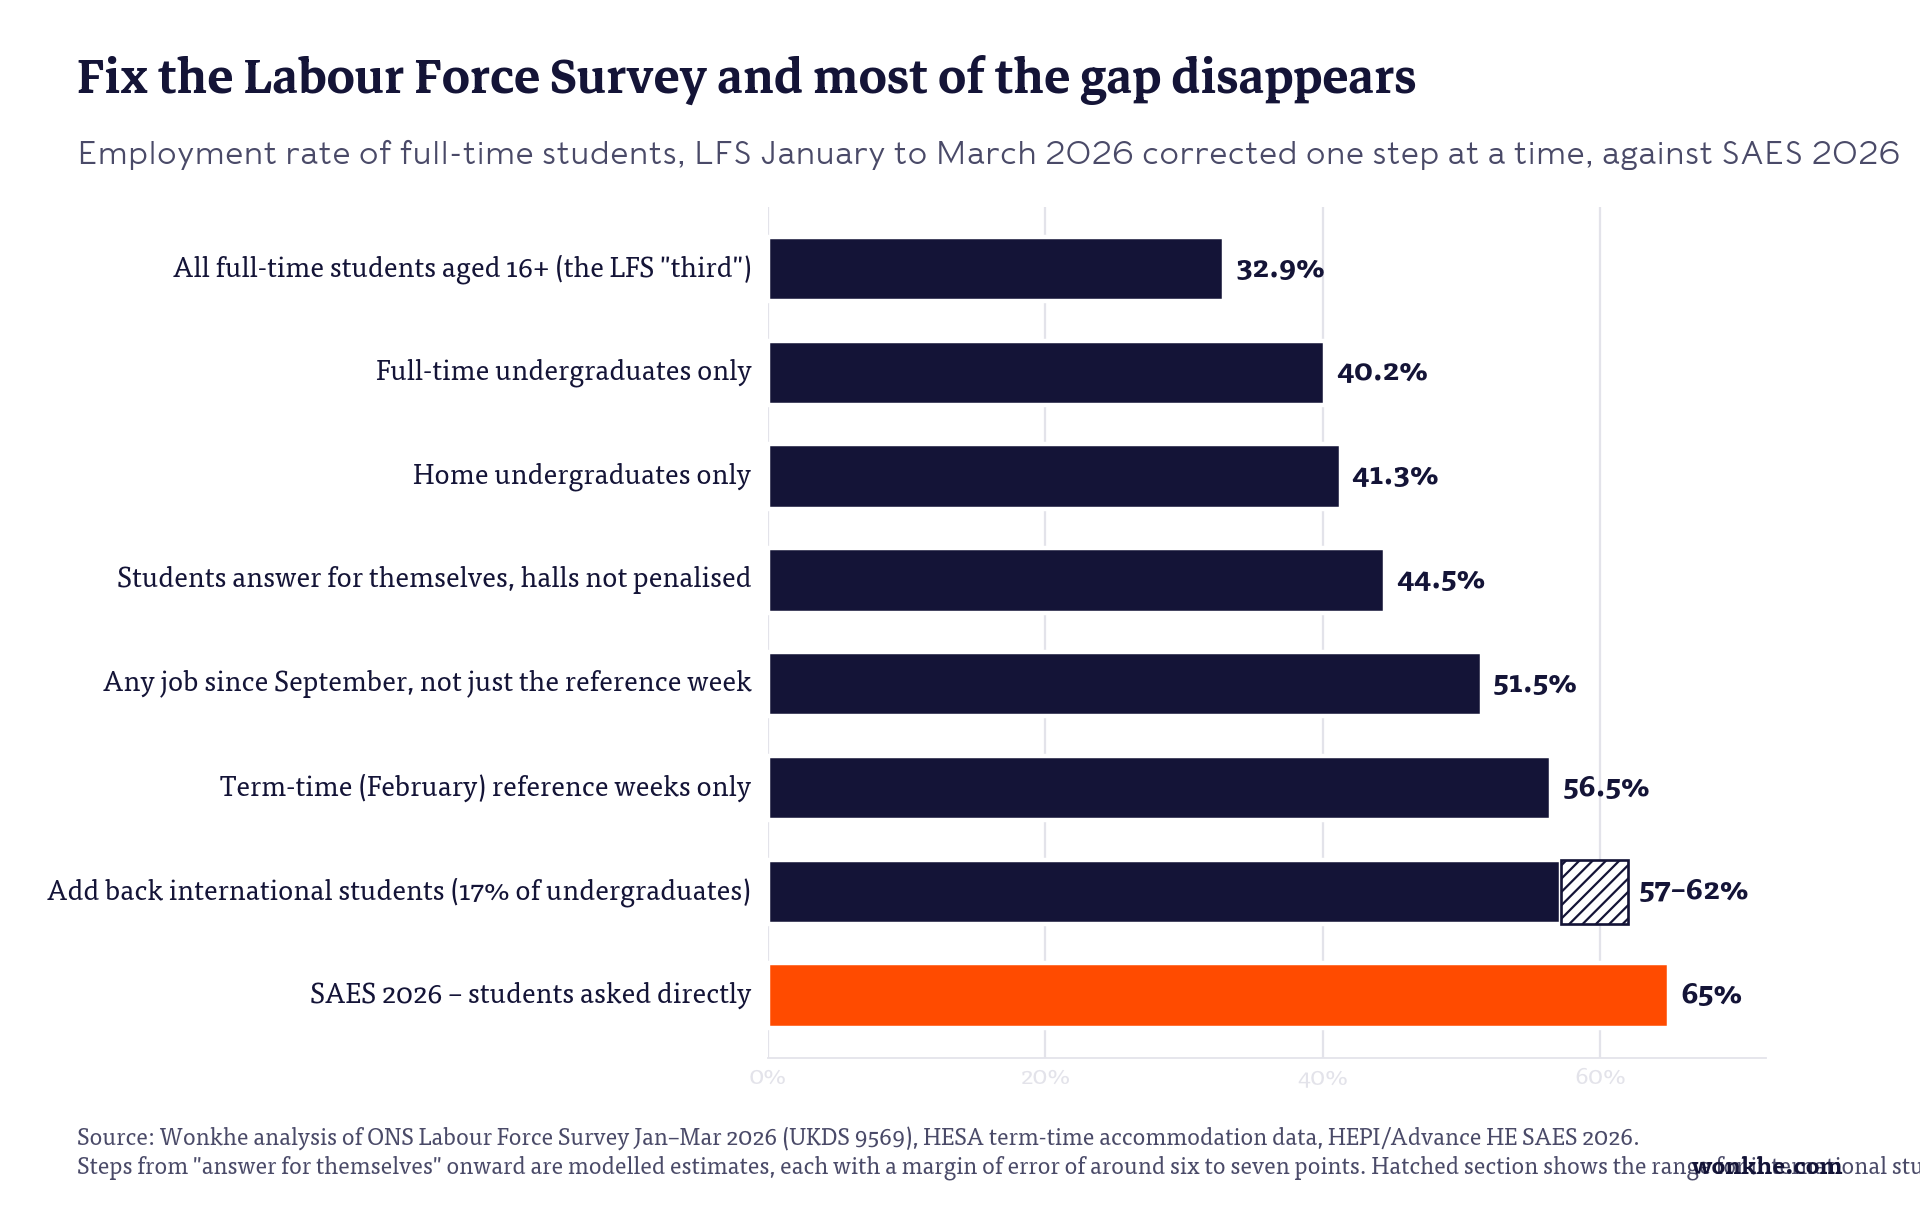
The thing to do is start with the 32.9 per cent headline for all full-time students. Restricting it to university undergraduates takes it to 40.2 per cent, and focusing on home students – because the international sample is too small and too unusual to trust – gives 41.3 per cent.
Modelling the rate if every student answered for themselves, and if students in halls weren’t marked down against otherwise similar students, takes it to 44.5 per cent. Counting students who have had a job at any point since September, rather than only in the reference week, takes it to 51.5 per cent. And using February reference weeks rather than the whole quarter takes it to 56.5 per cent.
Then add back international students at their 17 per cent share of full-time undergraduates. If they work at the same rate as home students in the SAES, the combined figure is about 57 per cent. If they work at the 80 per cent the SAES reports, it’s about 60 per cent. If students whose visas cap their hours at 20 a week under-report even to an anonymous survey, it could be 62 per cent.
That leaves three to eight points between a corrected Labour Force Survey and the SAES – and with each step carrying a margin of error of six or seven points, the residual is within the uncertainty.
The SAES series has been jumpy – 45 per cent in 2023, 56 per cent in 2024, 68 per cent in 2025, and 65 per cent this year – and a paid online panel weighted on demographics but not on anything financial may over-represent students who need the money. So the true figure might be a bit below 65 per cent – DfE’s own survey found 58 per cent in 2021–22.
But it really doesn’t sit anywhere near a third – and a survey with all of the problems above is a terrible basis for claiming that student work is falling.
What needs to change
The ONS is already replacing the Labour Force Survey with an online-first Transformed Labour Force Survey – a switch that has been pushed back to November 2027 at the earliest. That makes the next year the moment to fix how students are counted.
The simplest change is a doddle. ONS could publish a higher education series based on the qualification students are studying for, separate from school and college students – and ministers could stop using the other one to make claims about universities.
Next, the survey already has a separate sampling list for NHS staff accommodation. There is no obvious reason why the same couldn’t be done for university halls and purpose-built student accommodation – providers (should?) know where their students live, and operators know where their beds are.
An online-first survey should make it easier to get a personal response from students living away from home, and published estimates should say how much comes from proxies and carried-forward answers. A short additional question – whether students have done any paid work this term, or in the last four weeks – would capture the irregular work that the reference week misses. And the survey’s weights should be checked against HESA’s totals rather than proportions from 2011.
ONS has already explored measuring students’ economic activity using administrative data. Linking HESA or Student Loans Company records to HMRC’s real-time PAYE data would miss cash-in-hand work, but it wouldn’t depend on a parent’s memory. And DfE should commission a new Student Income and Expenditure Survey – the last one covered 2021/22, before the cost of living crisis properly kicked in.
Why it matters
Alan Milburn’s review of young people and work reported in May that close to a million 16 to 24 year olds are not in education, employment, or training – a figure that comes from the same Labour Force Survey. If the survey can’t find hundreds of thousands of students living away from home, the picture it paints of young people outside education is affected too.
And if the government thinks that fewer students are working, it will draw very different conclusions about whether maintenance support is adequate – and about who is competing for the entry-level jobs that the Milburn review says are disappearing.
SAES, DfE’s own survey, and now a line-by-line reconstruction of the Labour Force Survey all point the same way. Most full-time students work during term time. The official survey mostly can’t tell – and until it can, nobody in or advising government should be using it to argue otherwise.
Related articles

Boards can’t predict the future, but they can make sure their institution is ready for it
Debbie McVitty | Comment | 19/10/26

What counts as a graduate outcome when the labour market is changing?
Angel Tan | Comment | 16/10/26

Widening participation isn’t finished while background still predicts destination
Hannah Rolley | Comment | 16/10/26