Those getting a shout out as needing help included working people, pensioners, motorists, hauliers, farmers, carers, ex-mineworkers, the lowest paid, women, self-employed fathers, small brewers, savers, young founders, renters, first-time buyers, rough sleepers and, briefly, Ukrainians.
Universities got a mention as one of the “top-ranking” national strengths. Students didn’t get a mention at all.
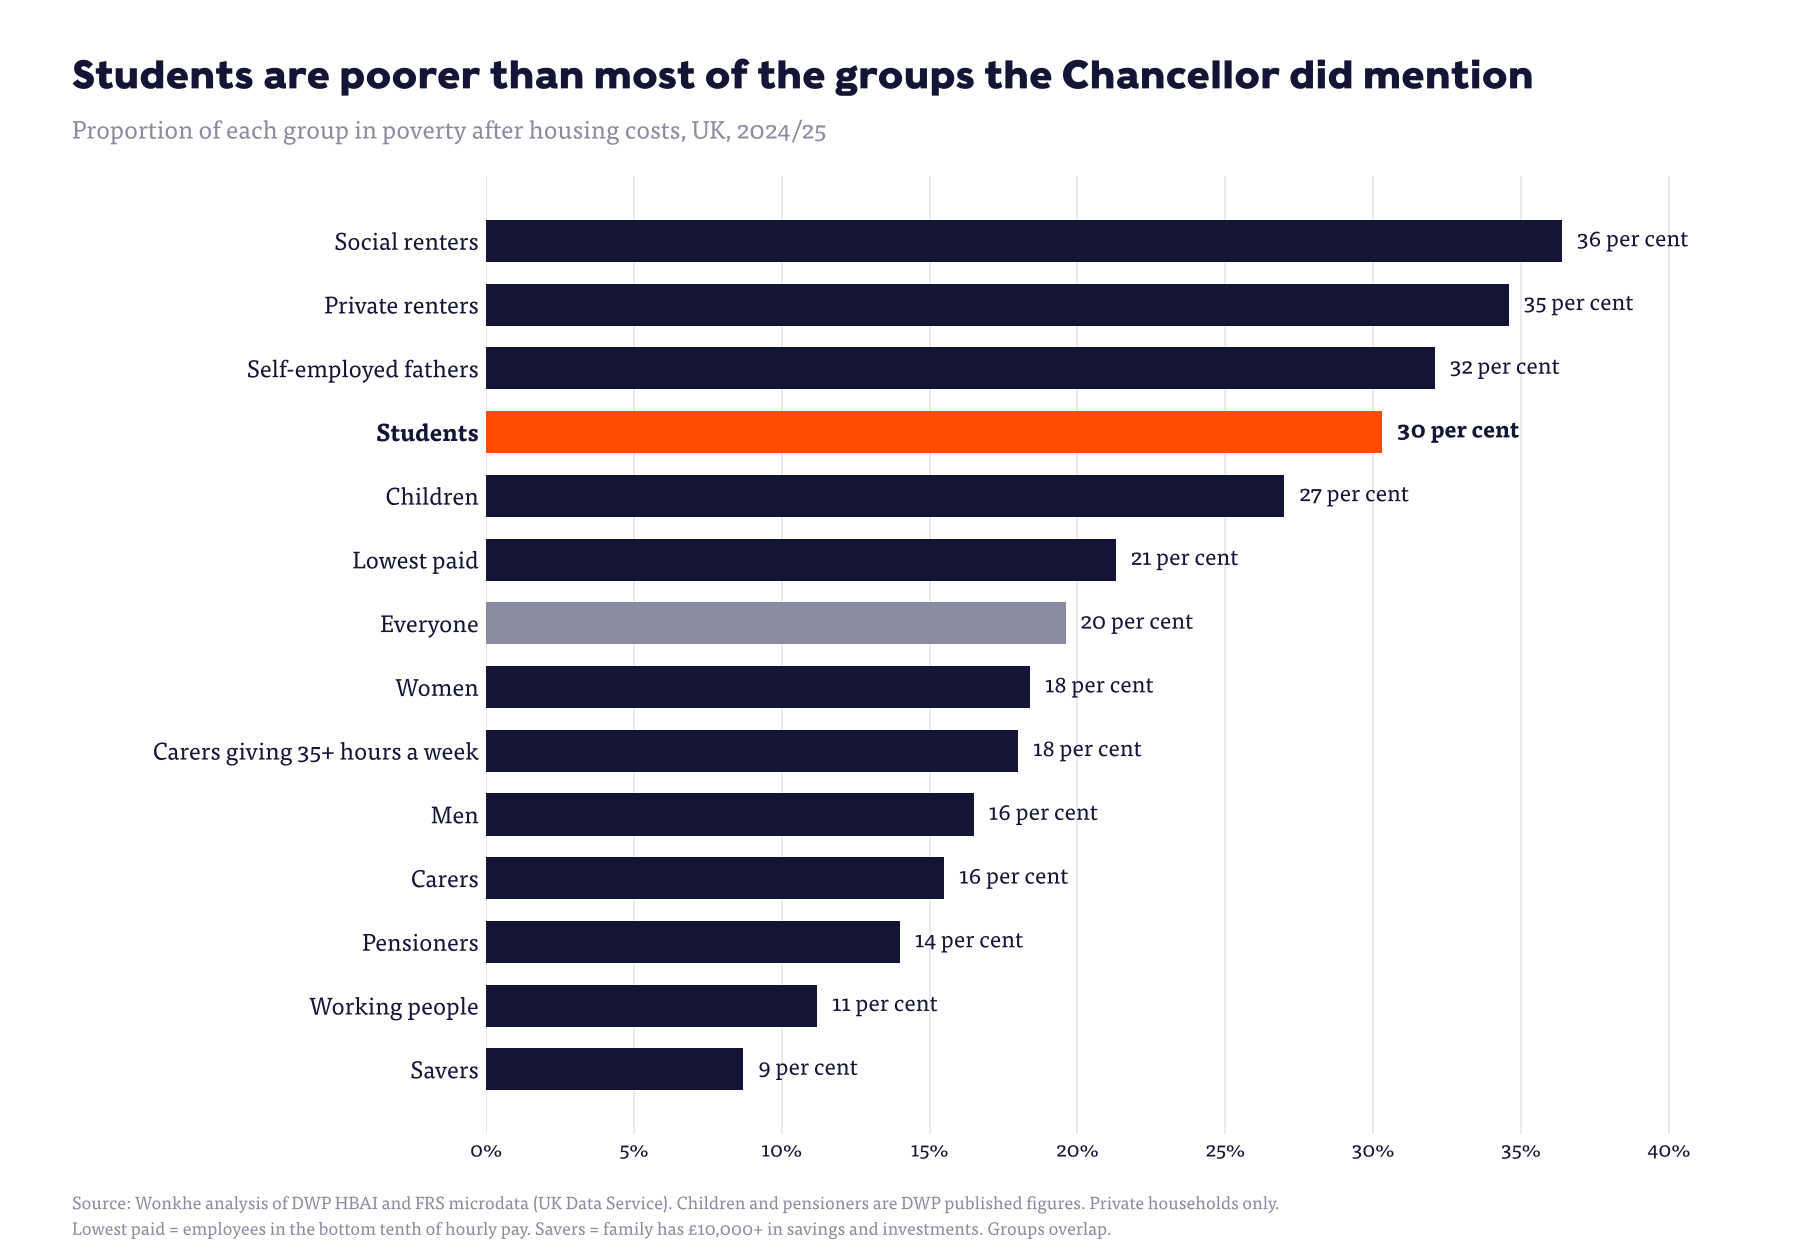
On the face of things, it’s baffling. Using 2024/25 data and DWP’s own poverty measure after housing costs, 11 per cent of working people are in poverty, 14 per cent of pensioners, 16 per cent of carers, 18 per cent of women, 21 per cent of the lowest paid and 27 per cent of children – with social and private renters, at around 35 per cent, the worst off of the groups the Chancellor chose to name.
Savers, who got to keep their £20,000 cash ISA limit, have a poverty rate of 9 per cent. Students, meanwhile, come in at 30 per cent on the official method. And that’s the official method.
Two days later, when Andy Burnham sat down with Healey to answer viewers’ questions on the Budget, students almost come up – Burnham asked “why didn’t you do anything about student loans?” as “a tougher question”.
Healey’s answer was that the government had “capped the rates for some of the types of loan”, and that he knew “how badly people feel this”. Burnham called it “one to come back to”, given “the sense of unfairness” for young people trying to make their way in life, before steering things on to the new “Your First Home” scheme for people in their 20s.
Capping the interest rate isn’t a giveaway – it’s the law, and the 6 per cent cap ends next August anyway. What Healey didn’t mention is that the freeze on the Plan 2 repayment threshold he inherited from Rachel Reeves is now worth £7.1bn to the Treasury, up from £5.9bn a year ago – because higher inflation means the threshold would otherwise have risen further.
In any case, the one question about students that made it into the conversation was really about graduates. Nobody asked, and nobody answered, how the over two million or so people currently studying full-time are supposed to pay the bills this winter.
There are lots of reasons why that might be – the money has already been spent, the politics of fees are radioactive, and nobody wins a marginal by announcing something for second years in Stoke.
But one of the reasons is surely that, as far as the official statistics on poverty and living standards are concerned, students barely exist as a group – and where they do show up, they look a lot better off than they actually are.
Unaccounted for
The UK’s official measure of poverty and income inequality is Households Below Average Income (HBAI), which DWP builds every year from DWP’s Family Resources Survey.
It’s the dataset that underpins the child poverty strategy, the absolute and relative poverty lines, and pretty much every claim a Chancellor (especially Labour Chancellors) makes about lifting people out of poverty.
It slices the population by age, family type, ethnicity, disability, region and tenure – but you won’t find full-time students broken out as a group in the headline tables. So I’ve done it, applying DWP’s own definitions and reproducing its published poverty counts to within a rounding error.
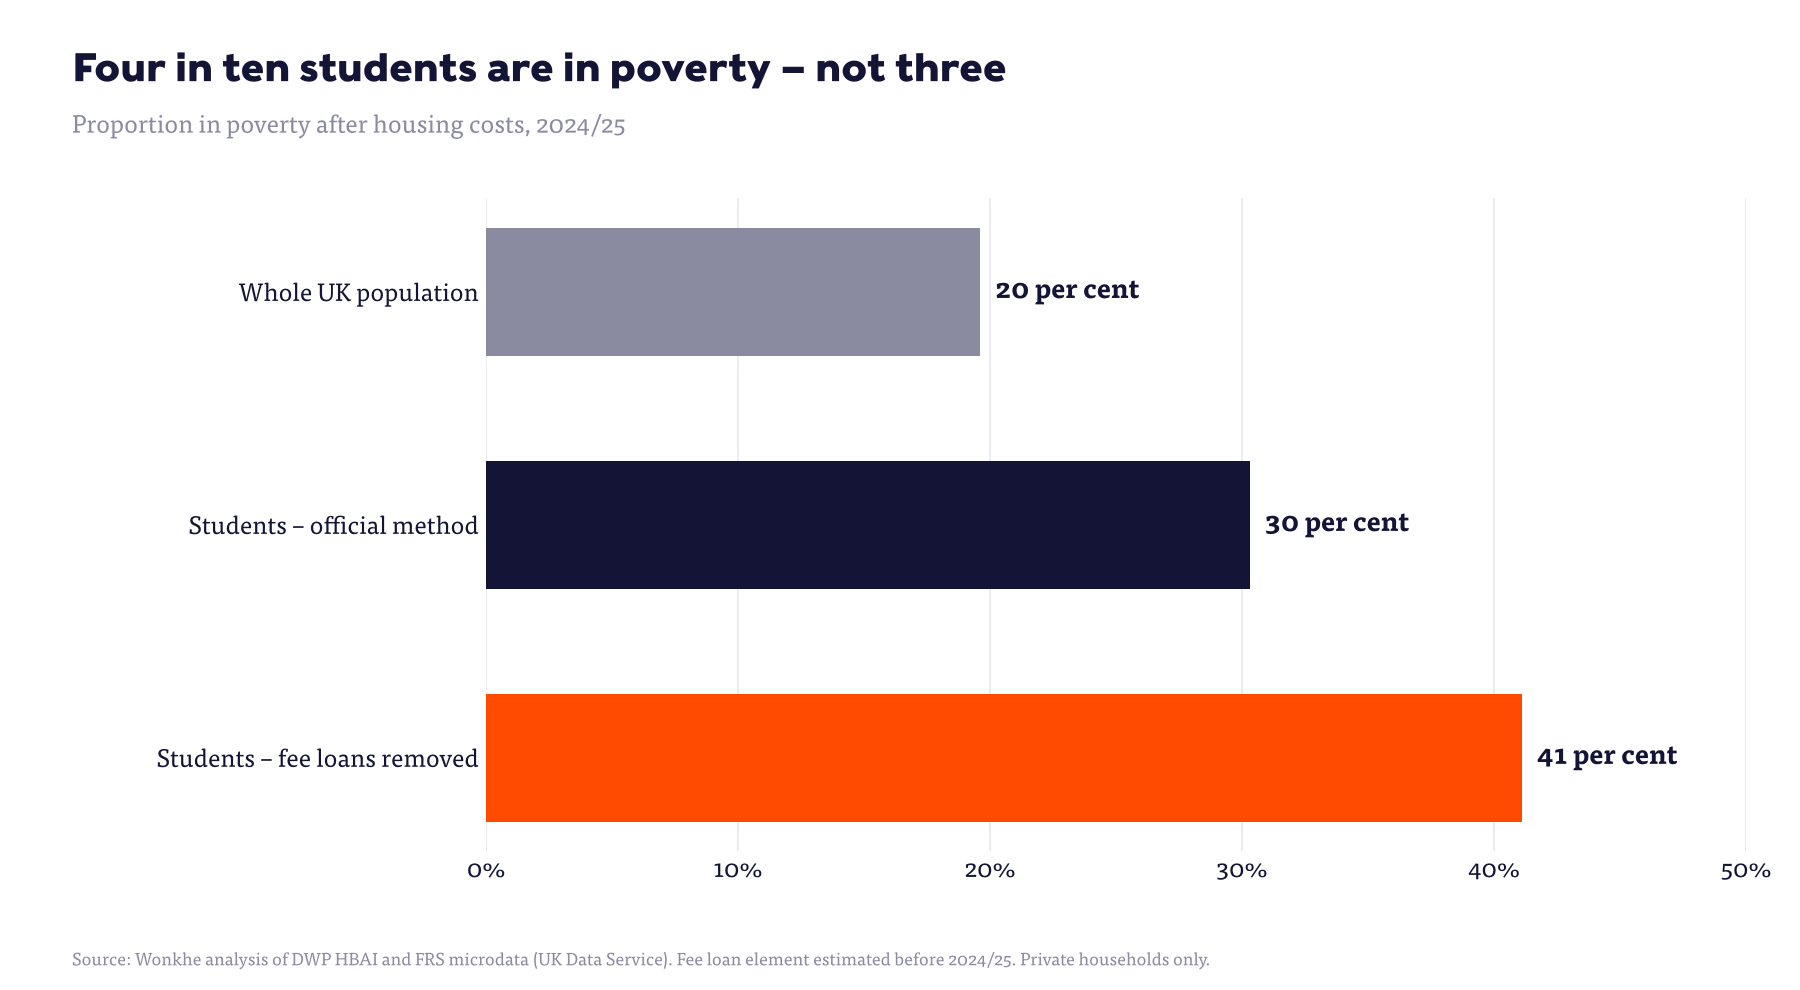
On DWP’s own method, around 634,000 full-time university students were living in poverty after housing costs in 2024/25 – 30 per cent of them, against 20 per cent of the population as a whole. Over the past fifteen years the official rate has drifted down from around 35 per cent to the mid-20s.
Caveat klaxon. The FRS only surveys private households, so students in halls – disproportionately first years, and disproportionately those who have moved away from home – aren’t in it at all. Samples are small (a few hundred students a year, and thinner still in the Covid years), so individual years bounce around. And DWP’s own methodology notes warn that information for students “should be treated with some caution” because of their irregular income flows.
That set aside, as I say, the good news is that the rate has been falling even if the bad news is that it’s still shamefully high, and higher than the groups our mental models assume are in poverty. The problem is that it’s much worse than it looks.
Phantom income
Regular readers will know the problem with the HBAI figures – “student loans are counted as income … with both the maintenance and tuition parts of the loan included.”
The maintenance loan is at least cash that manifests in a student’s bank account and gets spent on rent or food. The tuition fee loan not so much. It goes straight from the Student Loans Company to the university. The student never sees it, can’t spend it, and couldn’t buy a meal deal with it if they tried. Yet for the purposes of measuring poverty, a student on a £9,250 fee loan is treated as having an extra £177 a week tumbling into their household.
Strip and search
For 2024/25 the FRS records the fee loan element separately, so we can strip it out directly. For earlier years only the total amount borrowed is recorded, so I’ve estimated the fee element from the fee caps in each nation and year, calibrated against the actual 2024/25 split.
Take the fee loans out and around 860,000 full-time students were in poverty after housing costs in 2024/25 – 41 per cent of them, rather than 30 per cent. If you count everyone living in a household with a fee-loan student – parents and siblings included – the number in poverty goes from 547,000 to 954,000.
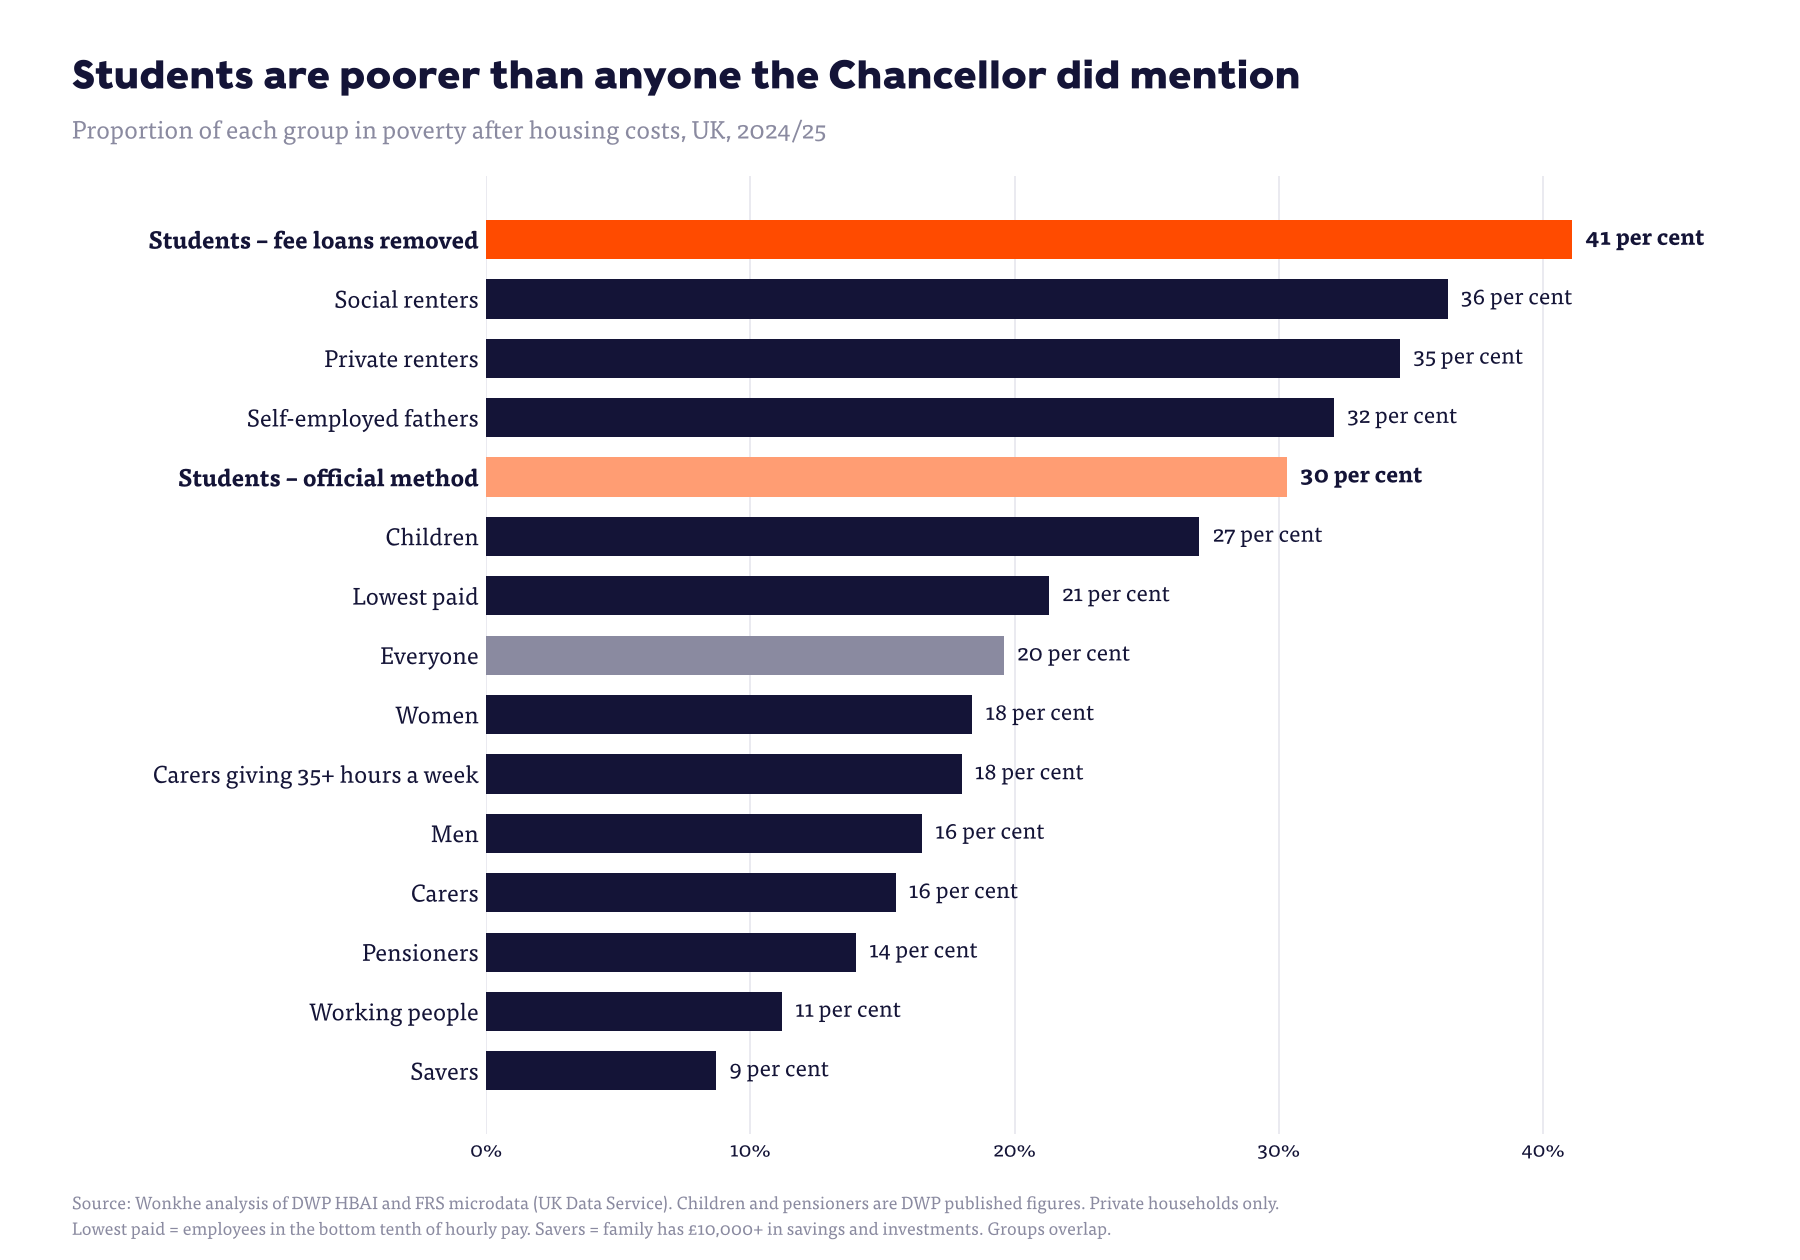
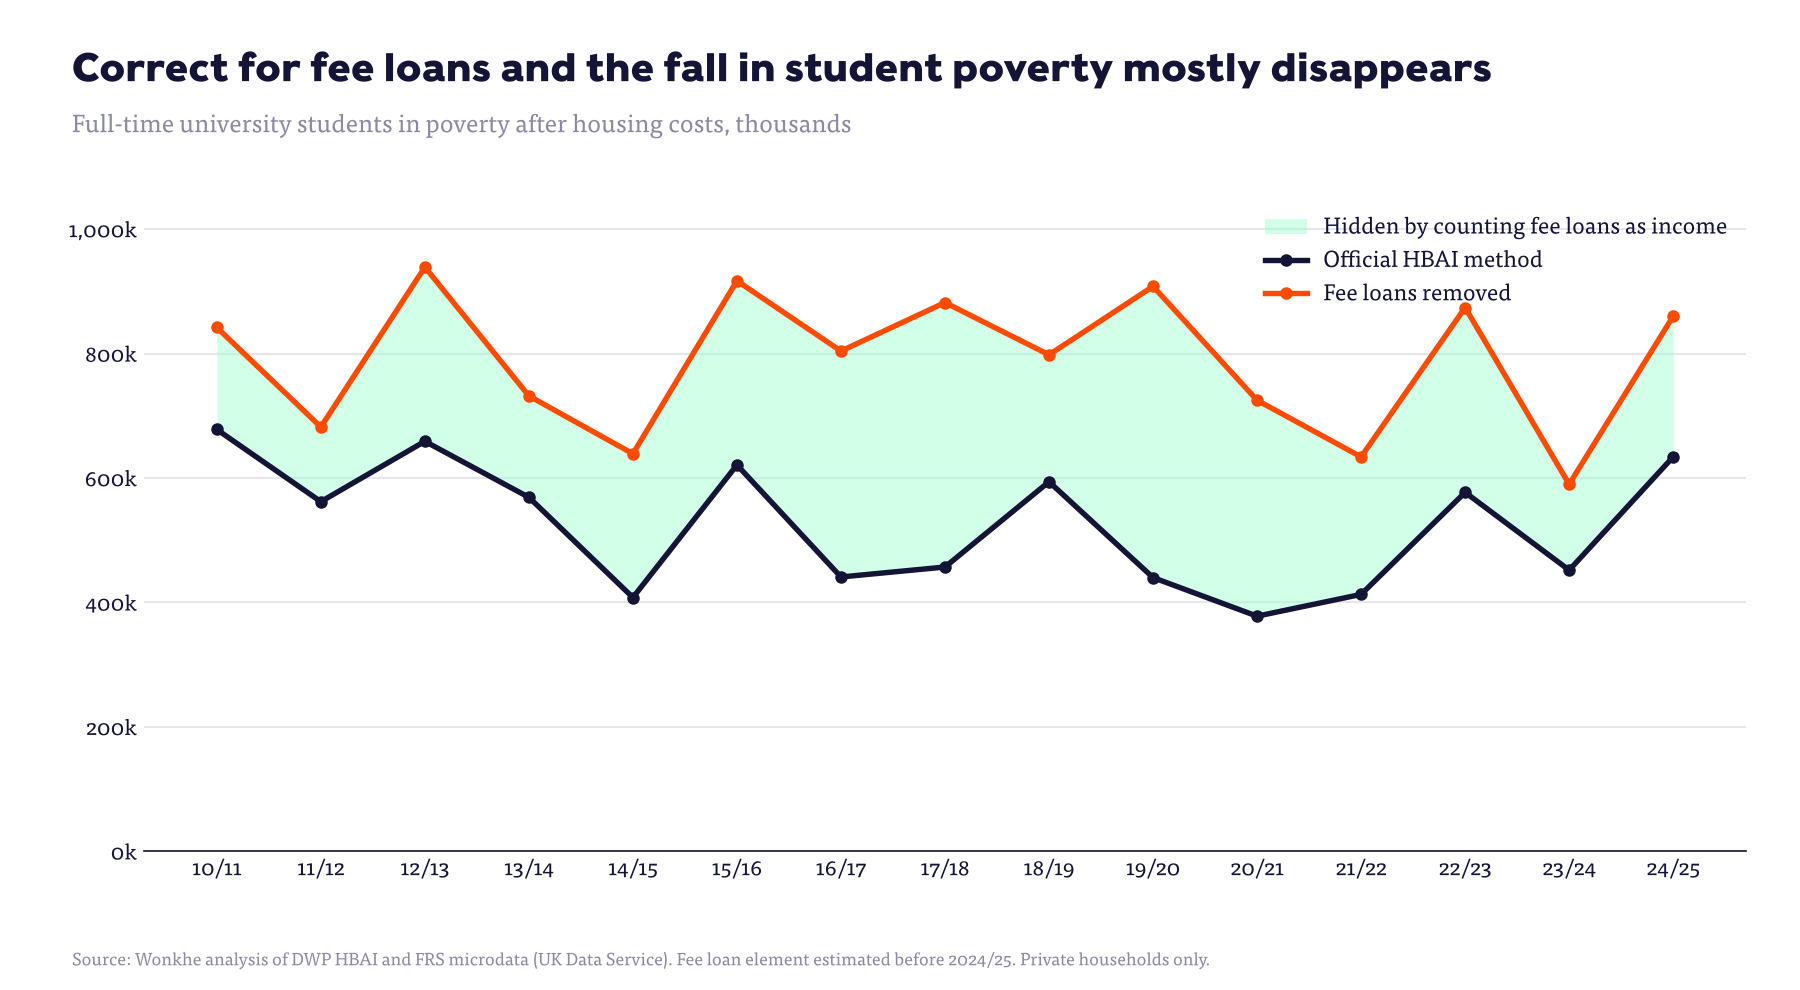
The time series tells a different story to the official one. On DWP’s method, student poverty falls as £9,000 fees arrive – which is what you’d expect if you’re counting a much bigger fee loan as income. Strip the fee loans out and the student poverty rate averages 43 to 45 per cent right through the 2010s, before easing to around 39 per cent in the 2020s – that’s mainly the fee freeze eroding the value of the thing being counted.
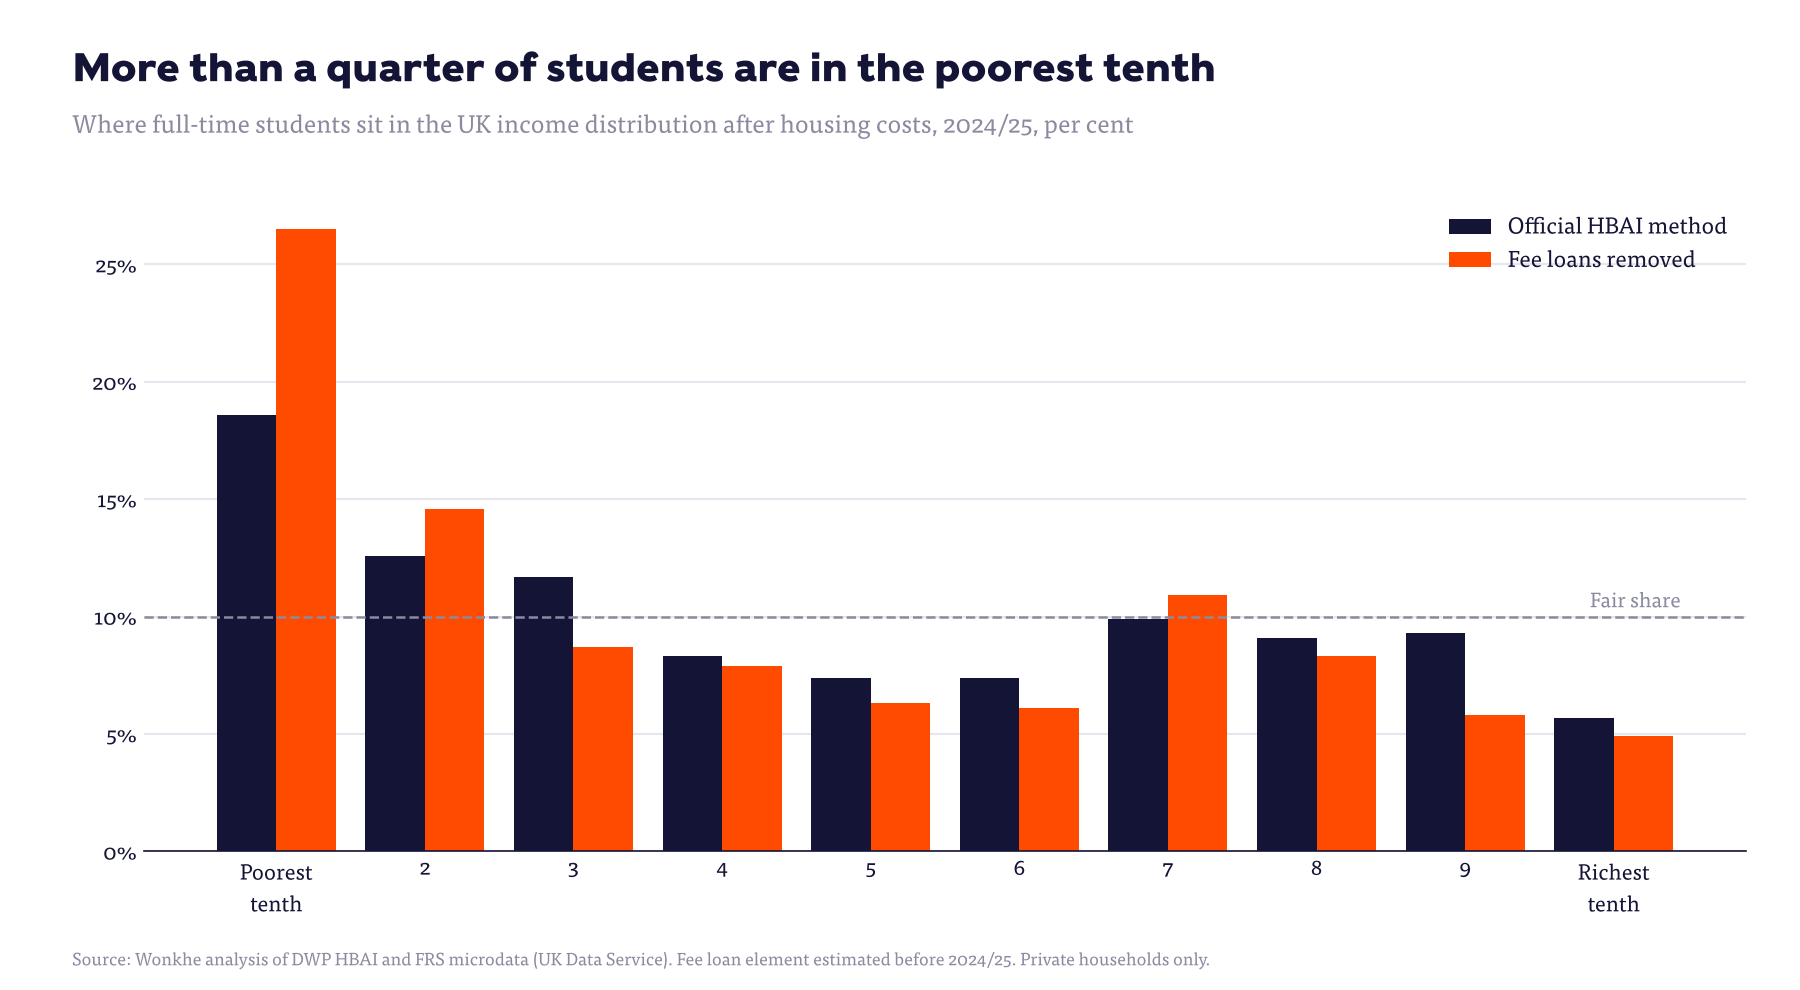
In terms of where students actually sit in the income distribution, the official method already has them over-represented at the bottom – 19 per cent in the poorest tenth of the country. Correct for fee loans and it’s more than a quarter (27 per cent), with 41 per cent in the poorest fifth.
The median is the message
Because HBAI’s poverty line is set at 60 per cent of median income, counting fee loans as income doesn’t just flatter students – it nudges up the median for everyone. In 2024/25, taking them out lowers median household income after housing costs from £623 to £617 a week, which in turn lowers the poverty line.
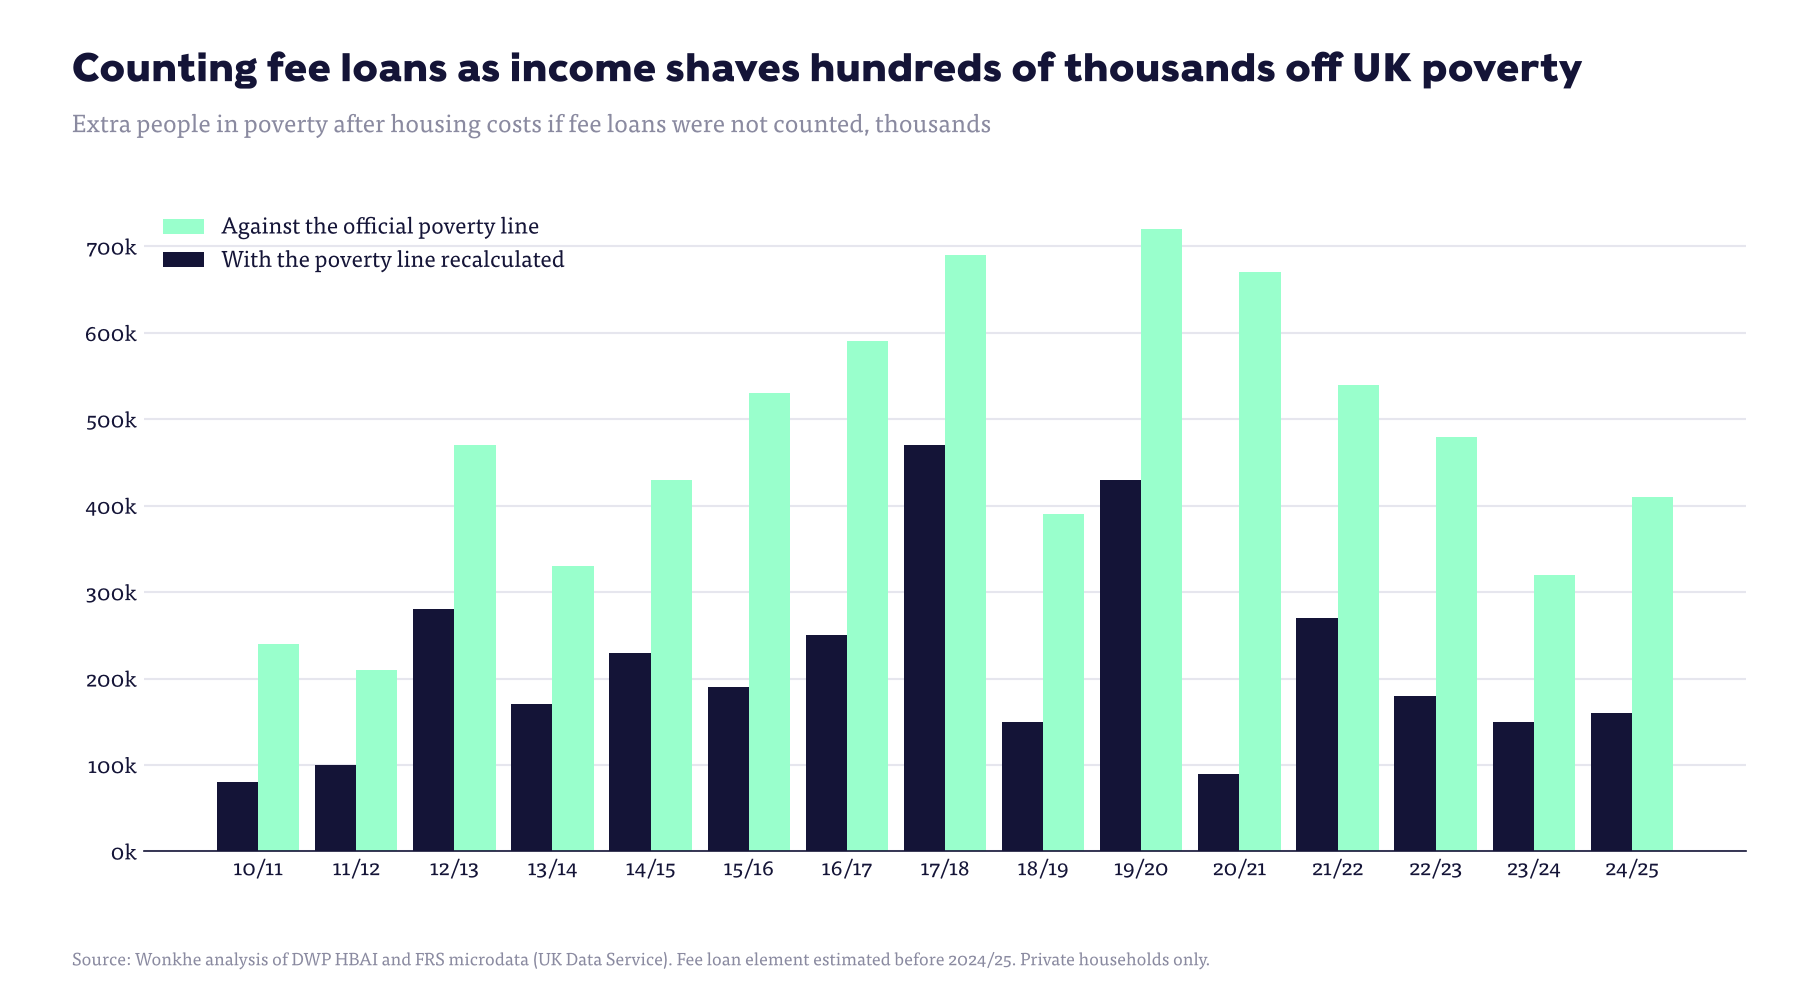
That has two effects. Against the official poverty line, around 410,000 more people would be counted as being in poverty after housing costs. But because the line itself falls, around 240,000 people in households with no student in them drop just above it – so the net rise in the headline total is a more modest 160,000 or so, from 13.39 million to 13.55 million.
Across the whole period, the effect against each year’s official line has ranged from around 210,000 before £9,000 fees to more than 700,000 at the end of the 2010s. Every poverty headline of the past decade has had a small but real student-shaped subsidy built into it.
Peer pressure
Ages ago now, the Resolution Foundation published a piece that showed that by 2014/15, students aged 18 to 22 in England apparently had higher average incomes than their non-student peers – but it was because of the £9,000 fee loan.
I’ve rebuilt it from the same data and extended it to 2024/25, adding the bit that matters – what students actually have once the fee loan is removed.
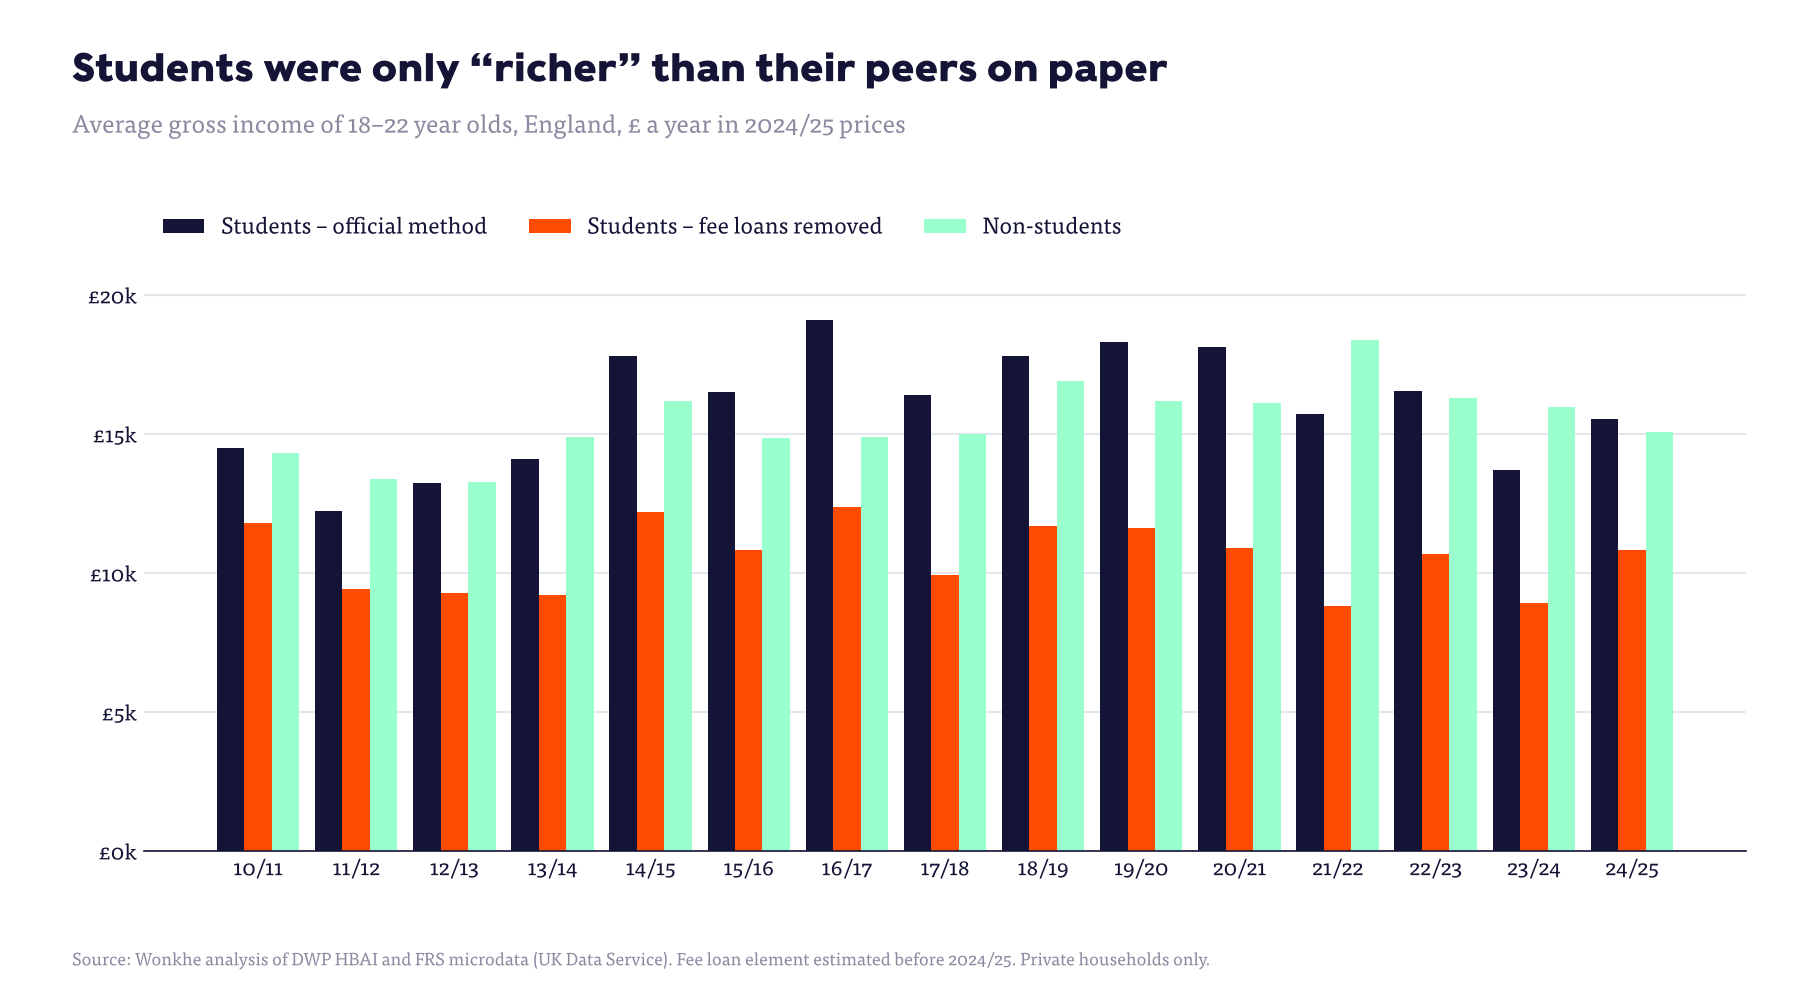
On the official method, students stayed “richer” than their peers right up to 2020/21. With the fee loan removed, they have been poorer in every single year – and the gap has widened. In real terms, students’ own incomes have been flat at around £10,000 to £11,000 a year for fifteen years, while non-students’ have risen. The average gap has gone from around £3,300 a year in the early 2010s to more than £6,000 in the 2020s.
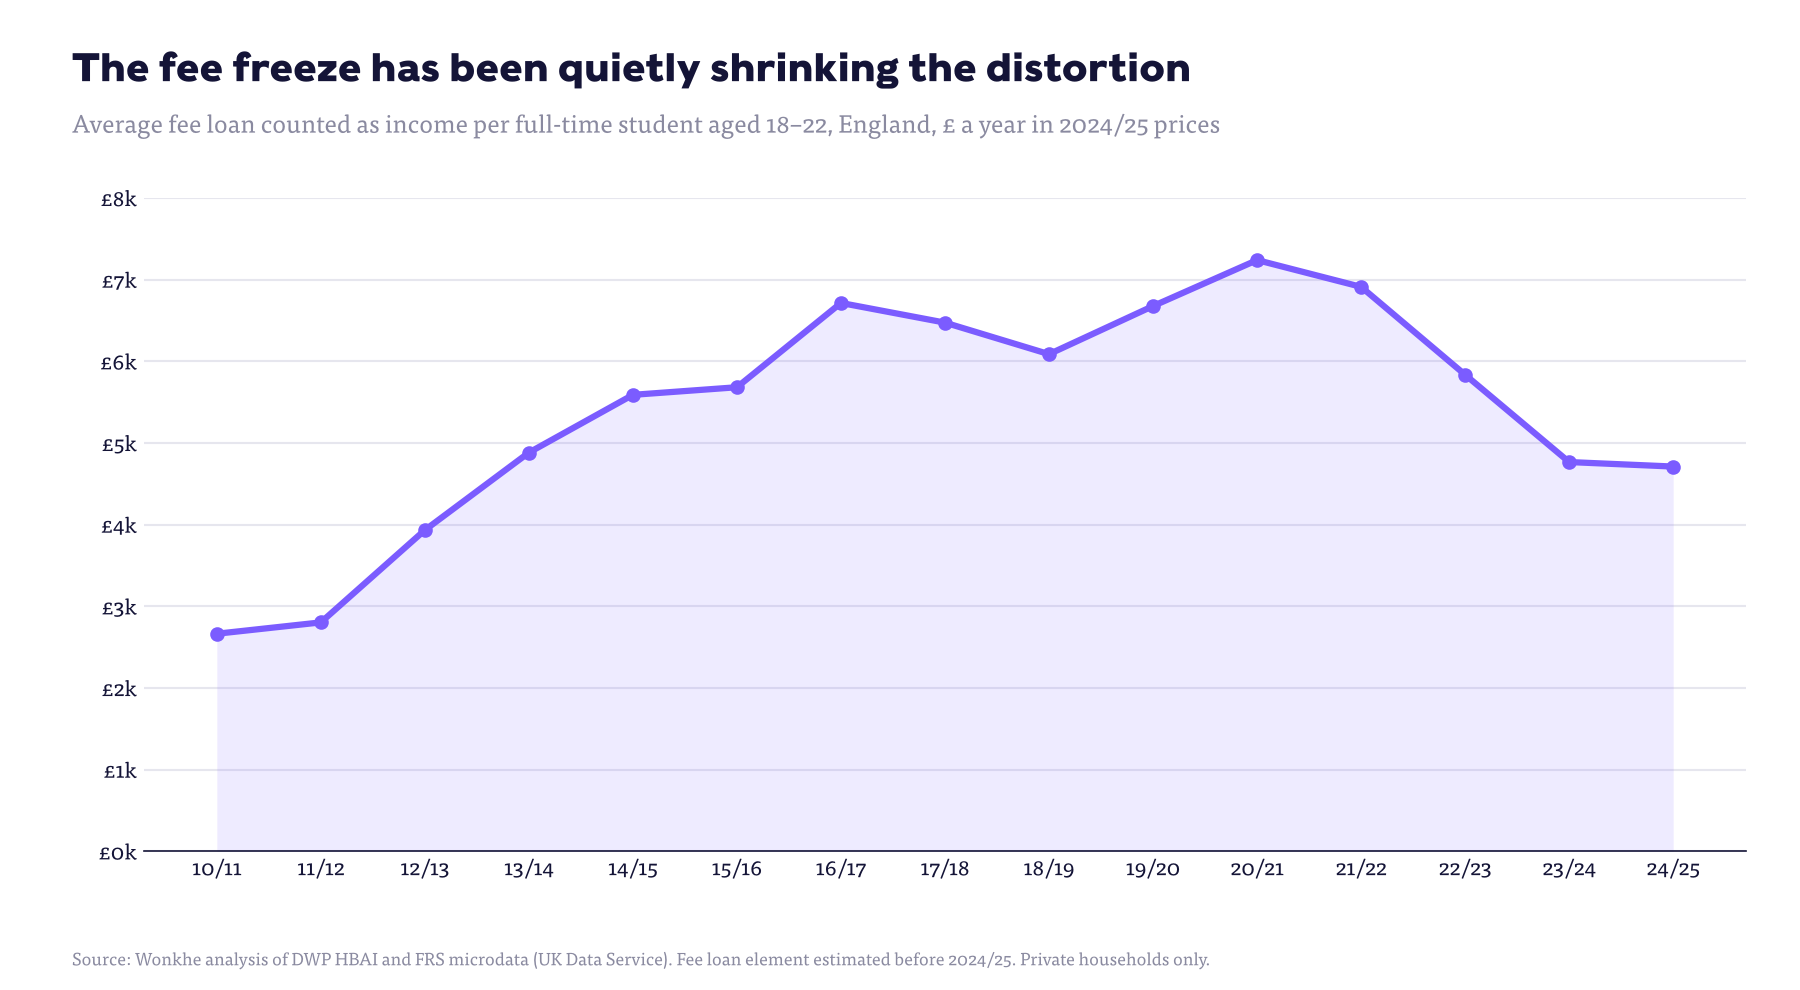
The only reason the official version has students dropping back below their peers is that the frozen £9,250 fee has lost value. The average fee loan counted as income per student peaked at over £7,000 in today’s prices and has since fallen to under £5,000 – not because anything got better for students, but because inflation chipped away at the thing being miscounted.
Survey says nothing
Part of the reason students drift out of view when Chancellors are deciding who to help is that there is so little official data on how they actually live.
DfE’s Student Income and Expenditure Survey – the only dedicated source on what students earn, borrow and spend, and the only one that includes students in halls – was last commissioned in late 2021, and the edition before it covered 2014/15.
As far as I can see, nothing has been commissioned since – so the most recent official picture of student finances predates the cost of living crisis and the worst of the rent increases.
That’s a shameful gap for a group of around two million people in private households alone, many of whom are working long hours to stay afloat. But even if DfE won’t pay for a proper survey, there’s a cheaper fix. The statisticians could just stop counting money that students never receive as income.
It would make student poverty look worse – because it is worse. It would remove a distortion that has flattered the UK’s poverty figures every year since 2012. And it would mean that the next time a Chancellor reads out a list of the people the government is going to help, the numbers on the desk in front of them would at least tell the truth about the ones left off it.