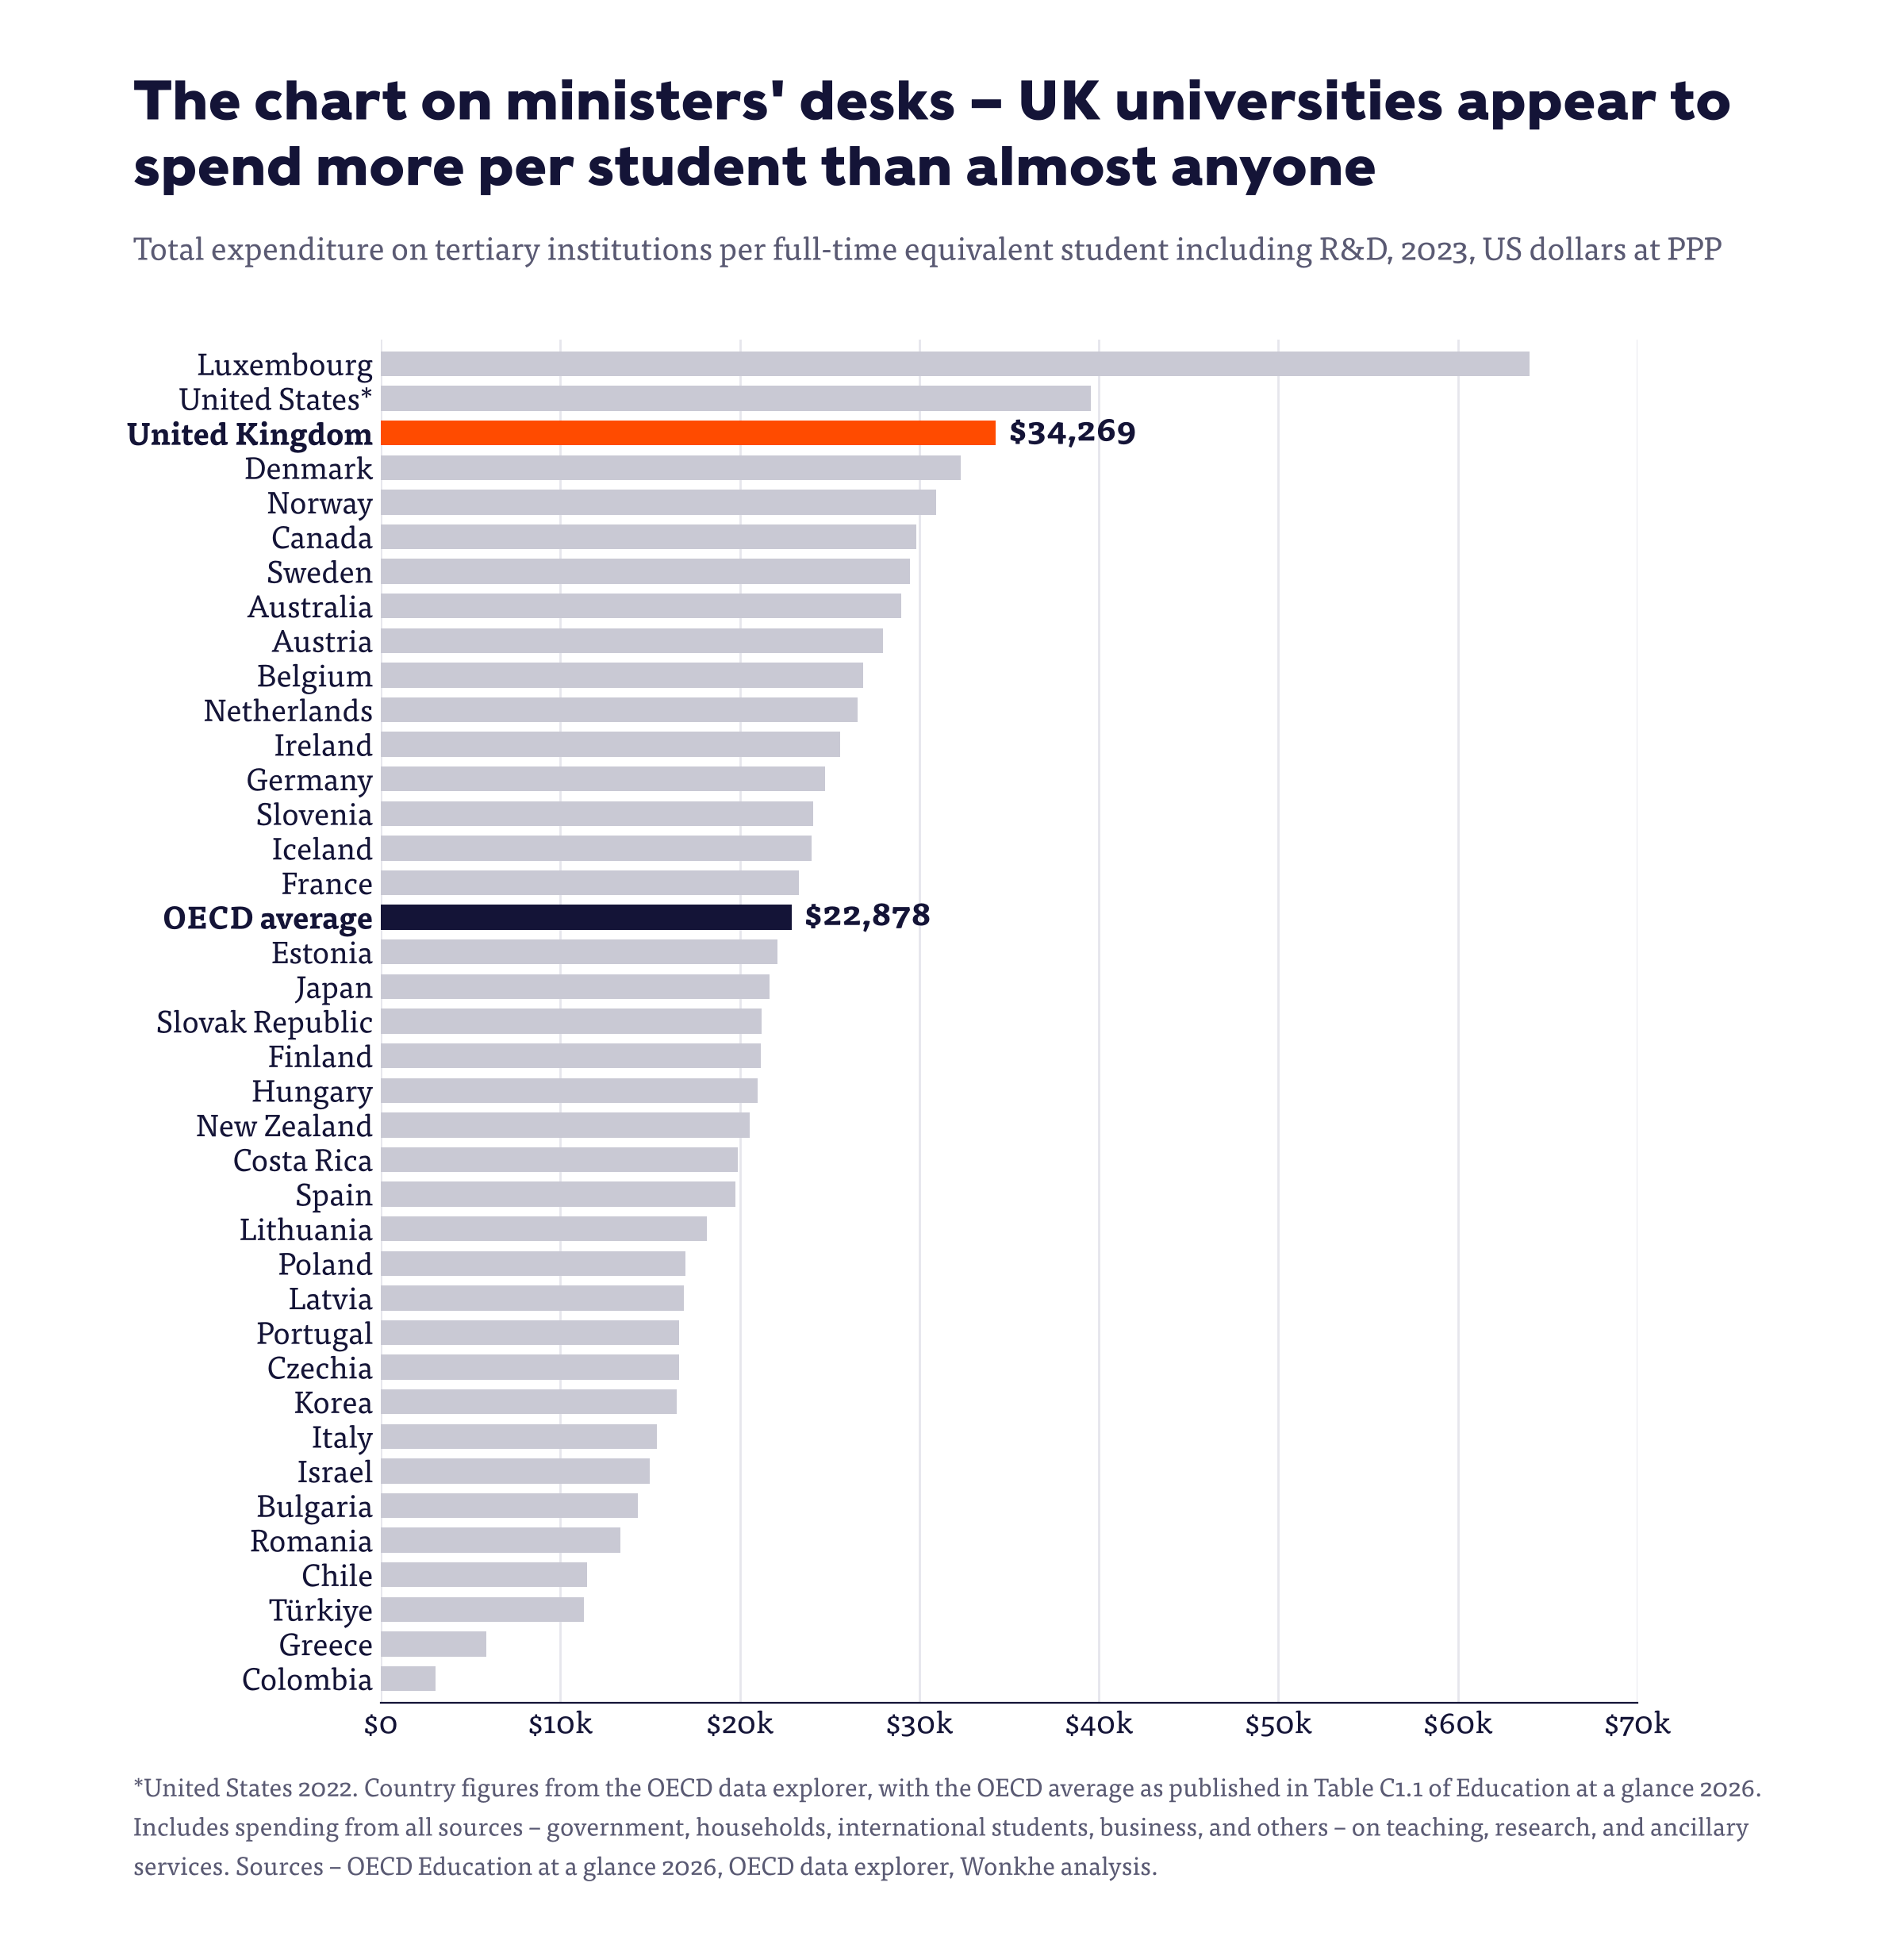
This year UK again looks like the OECD’s great outlier, appearing to spend far more per student than almost anyone else while asking the state to put up far less of it than almost anyone else.
The table shows institutions spending $34,269 per full-time equivalent student including R&D, against an OECD average of $22,878.
That puts us third behind Luxembourg and the US.
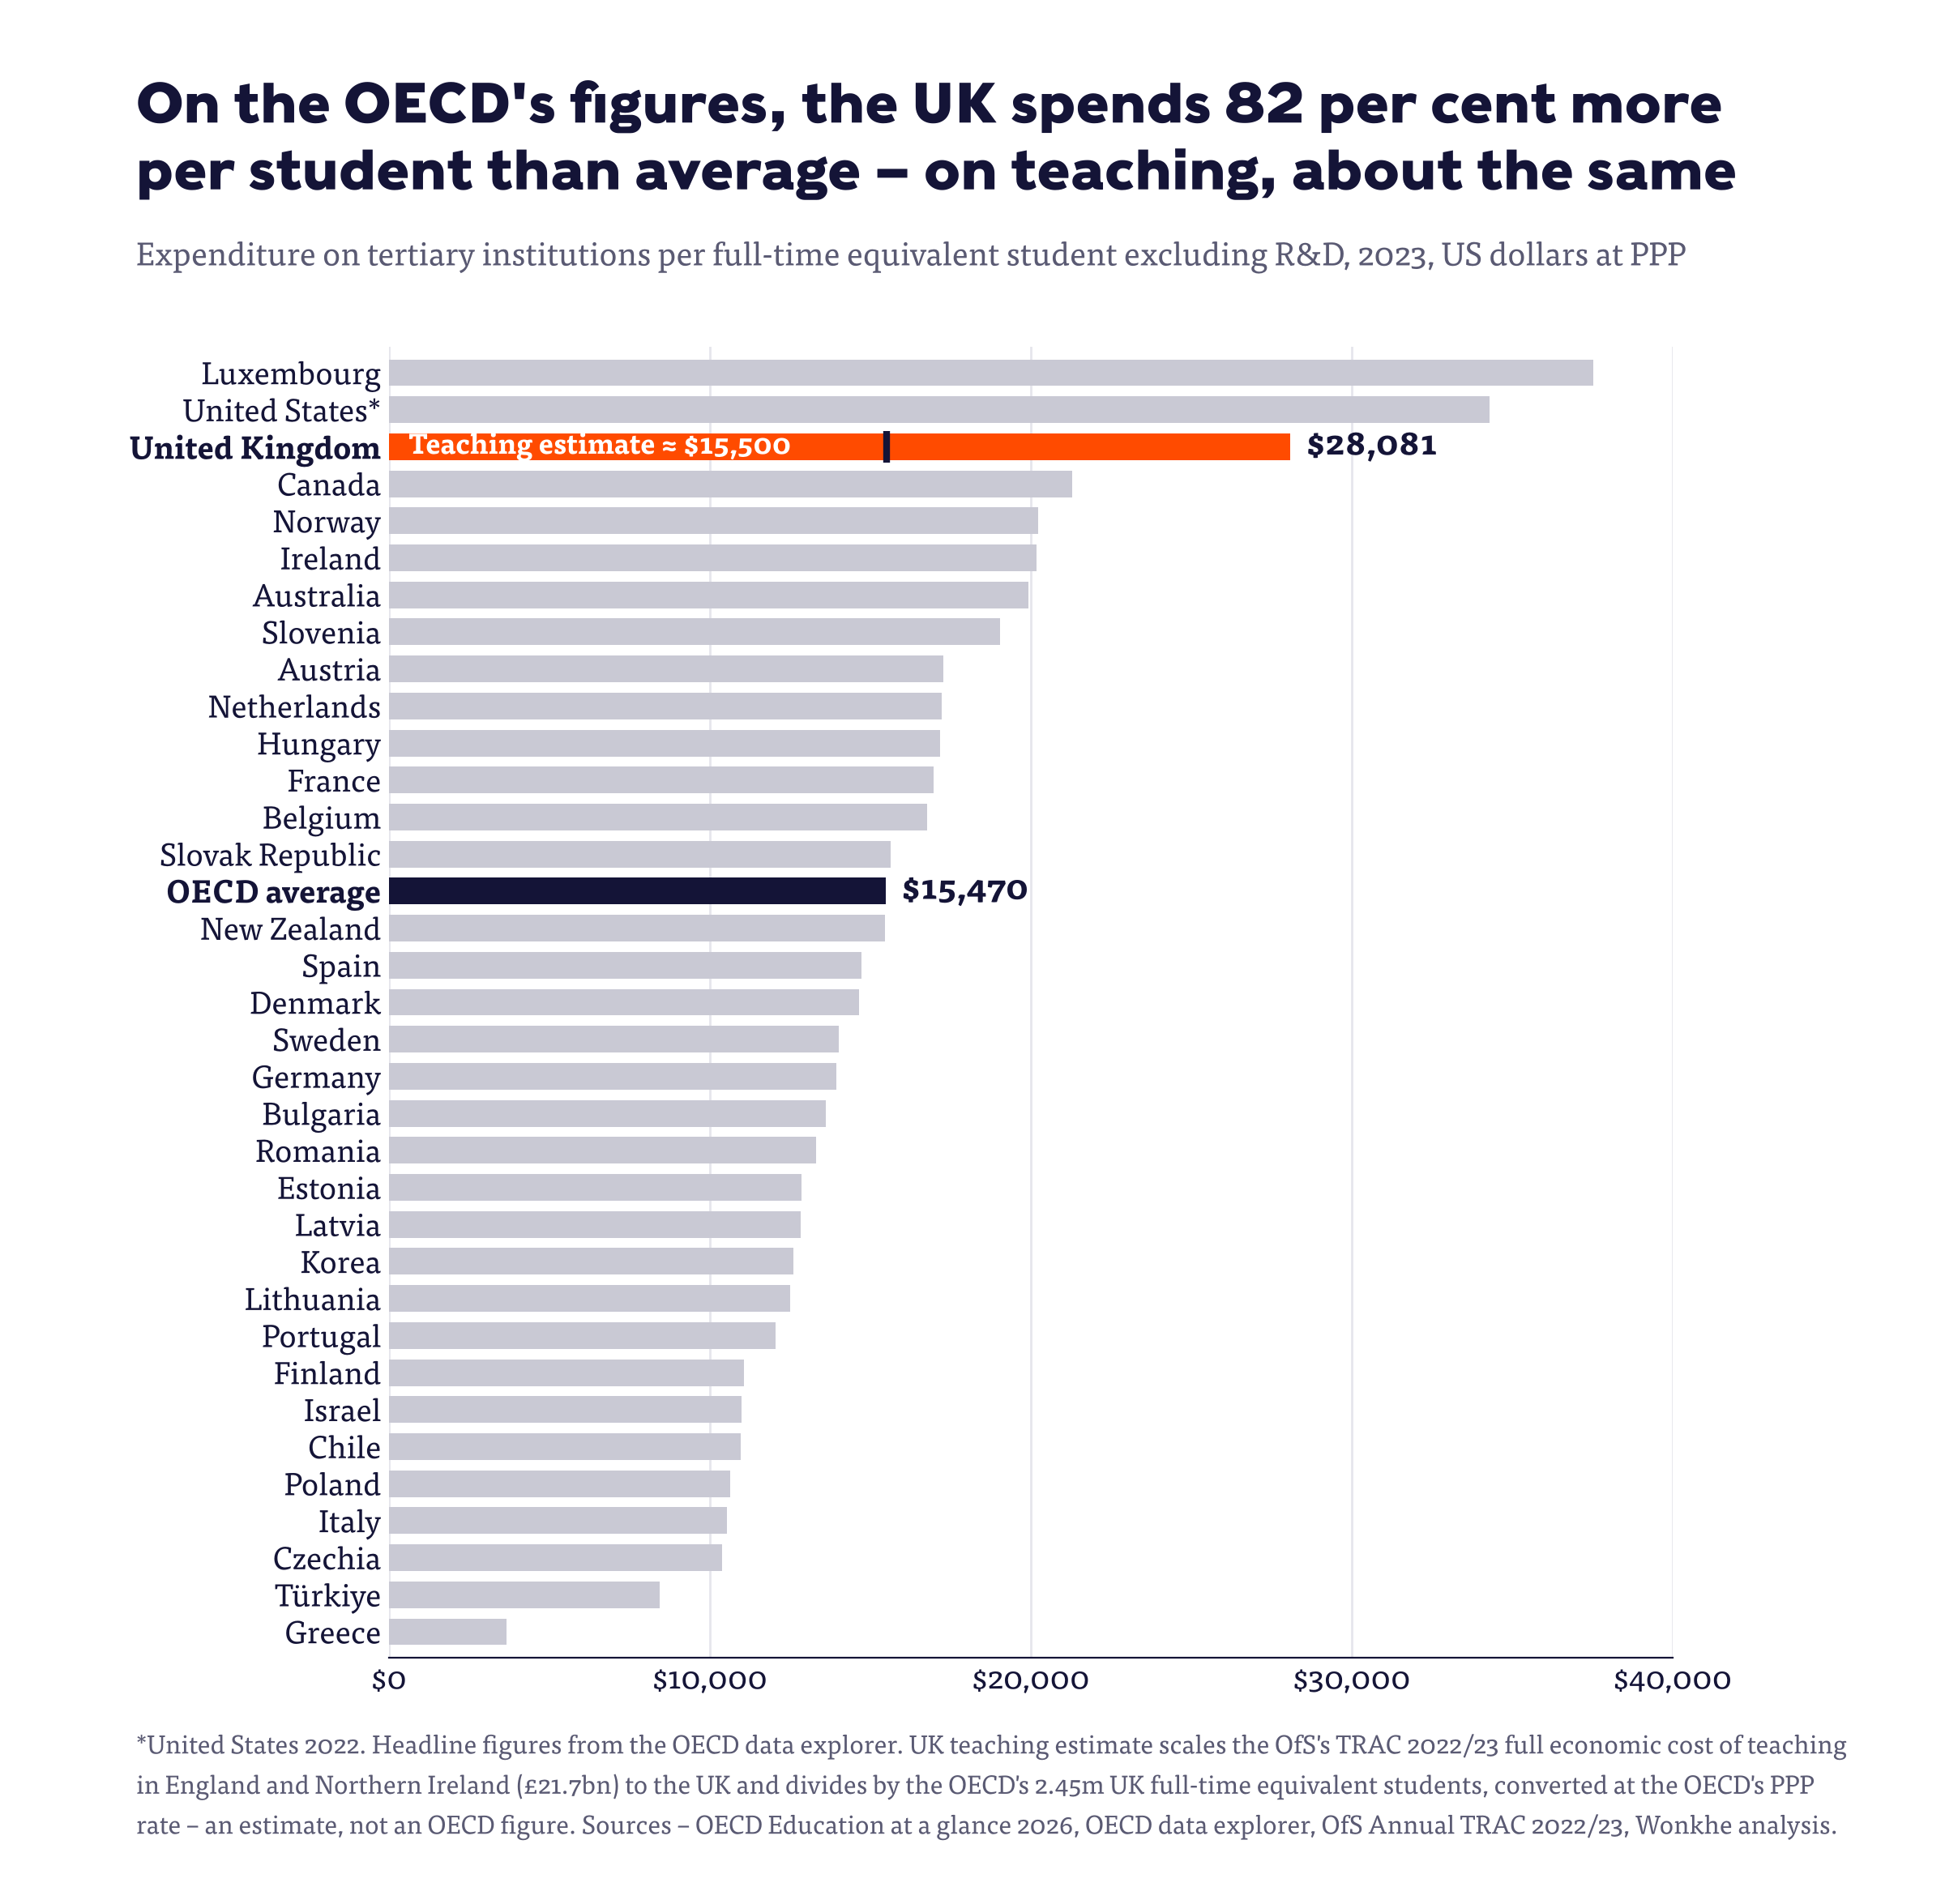
And no, it’s not research, at least not on the headlines. Strip out research and the UK spends $28,081 against an OECD average of $15,470 – a whopping 82 per cent more.
This all matters because it’s bound to end up on a minister’s desk. And anyone staring at that chart while the sector warns of deficits, course closures, and redundancy programmes could be forgiven for concluding that universities can take a lot more pain yet.
So anyway, I’ve had yet another run at what’s driving the disconnect between what the chart shows and how it feels on the ground.
This time I’ve managed to dig into the UK return behind the tables – most of it is available through the OECD’s data explorer – and I’ve whittled it down to four main things.
Income, not spending
The first is that the 2023 UK total is built on the income side of the excel sheet. It divides the £55.4bn that UK tertiary institutions received by 2.45m full-time equivalent students, which comes to about £22,600 a head.
But that £55.4bn includes an £8.7bn line labelled “adjustments for changes in fund balances”, which in 2023 was mostly the release of USS pension provisions after the scheme went into surplus.
That is money that was never spent on anything. On recorded spending, the per-student figure would fall to about $28,900.
A shrunken denominator
The second is how part-timers are counted.
When it converts headcounts to full-time equivalents, for some reason the UK counts each part-time student as only about 0.11 of a full-time one, where the Netherlands uses 0.5.
A smaller denominator means a bigger number per student, and the UK has well over half a million part-time students in the count.
Research hiding in teaching
The UK’s R&D line is narrow – it records £10bn of tertiary R&D, which is roughly what universities receive in research income.
But OfS’s TRAC data for 2022/23 put the full economic cost of research in England and Northern Ireland alone at £14.6bn, a £4.6bn hole that institutions fill largely from the £2.9bn surplus they make teaching international and other non-publicly funded students.
All of that unfunded research sits in the UK’s “excluding R&D” figure, along with most of the £6.8bn spent on residences, catering, conferences, and other commercial activity, of which the OECD strips out only £2.9bn as ancillary services.
Systems that estimate R&D from academic time-use surveys attribute around a third of spending to research on average, and more than half in Denmark and Sweden. The UK attributes… 18 per cent.
Short degrees
The big one for me is that the table is annual, and our degrees are short.
A standard bachelor’s runs for three years everywhere but Scotland, and the 2025 country note shows that 67 per cent of UK entrants finish within the standard length of their programme, against 43 per cent across the OECD.
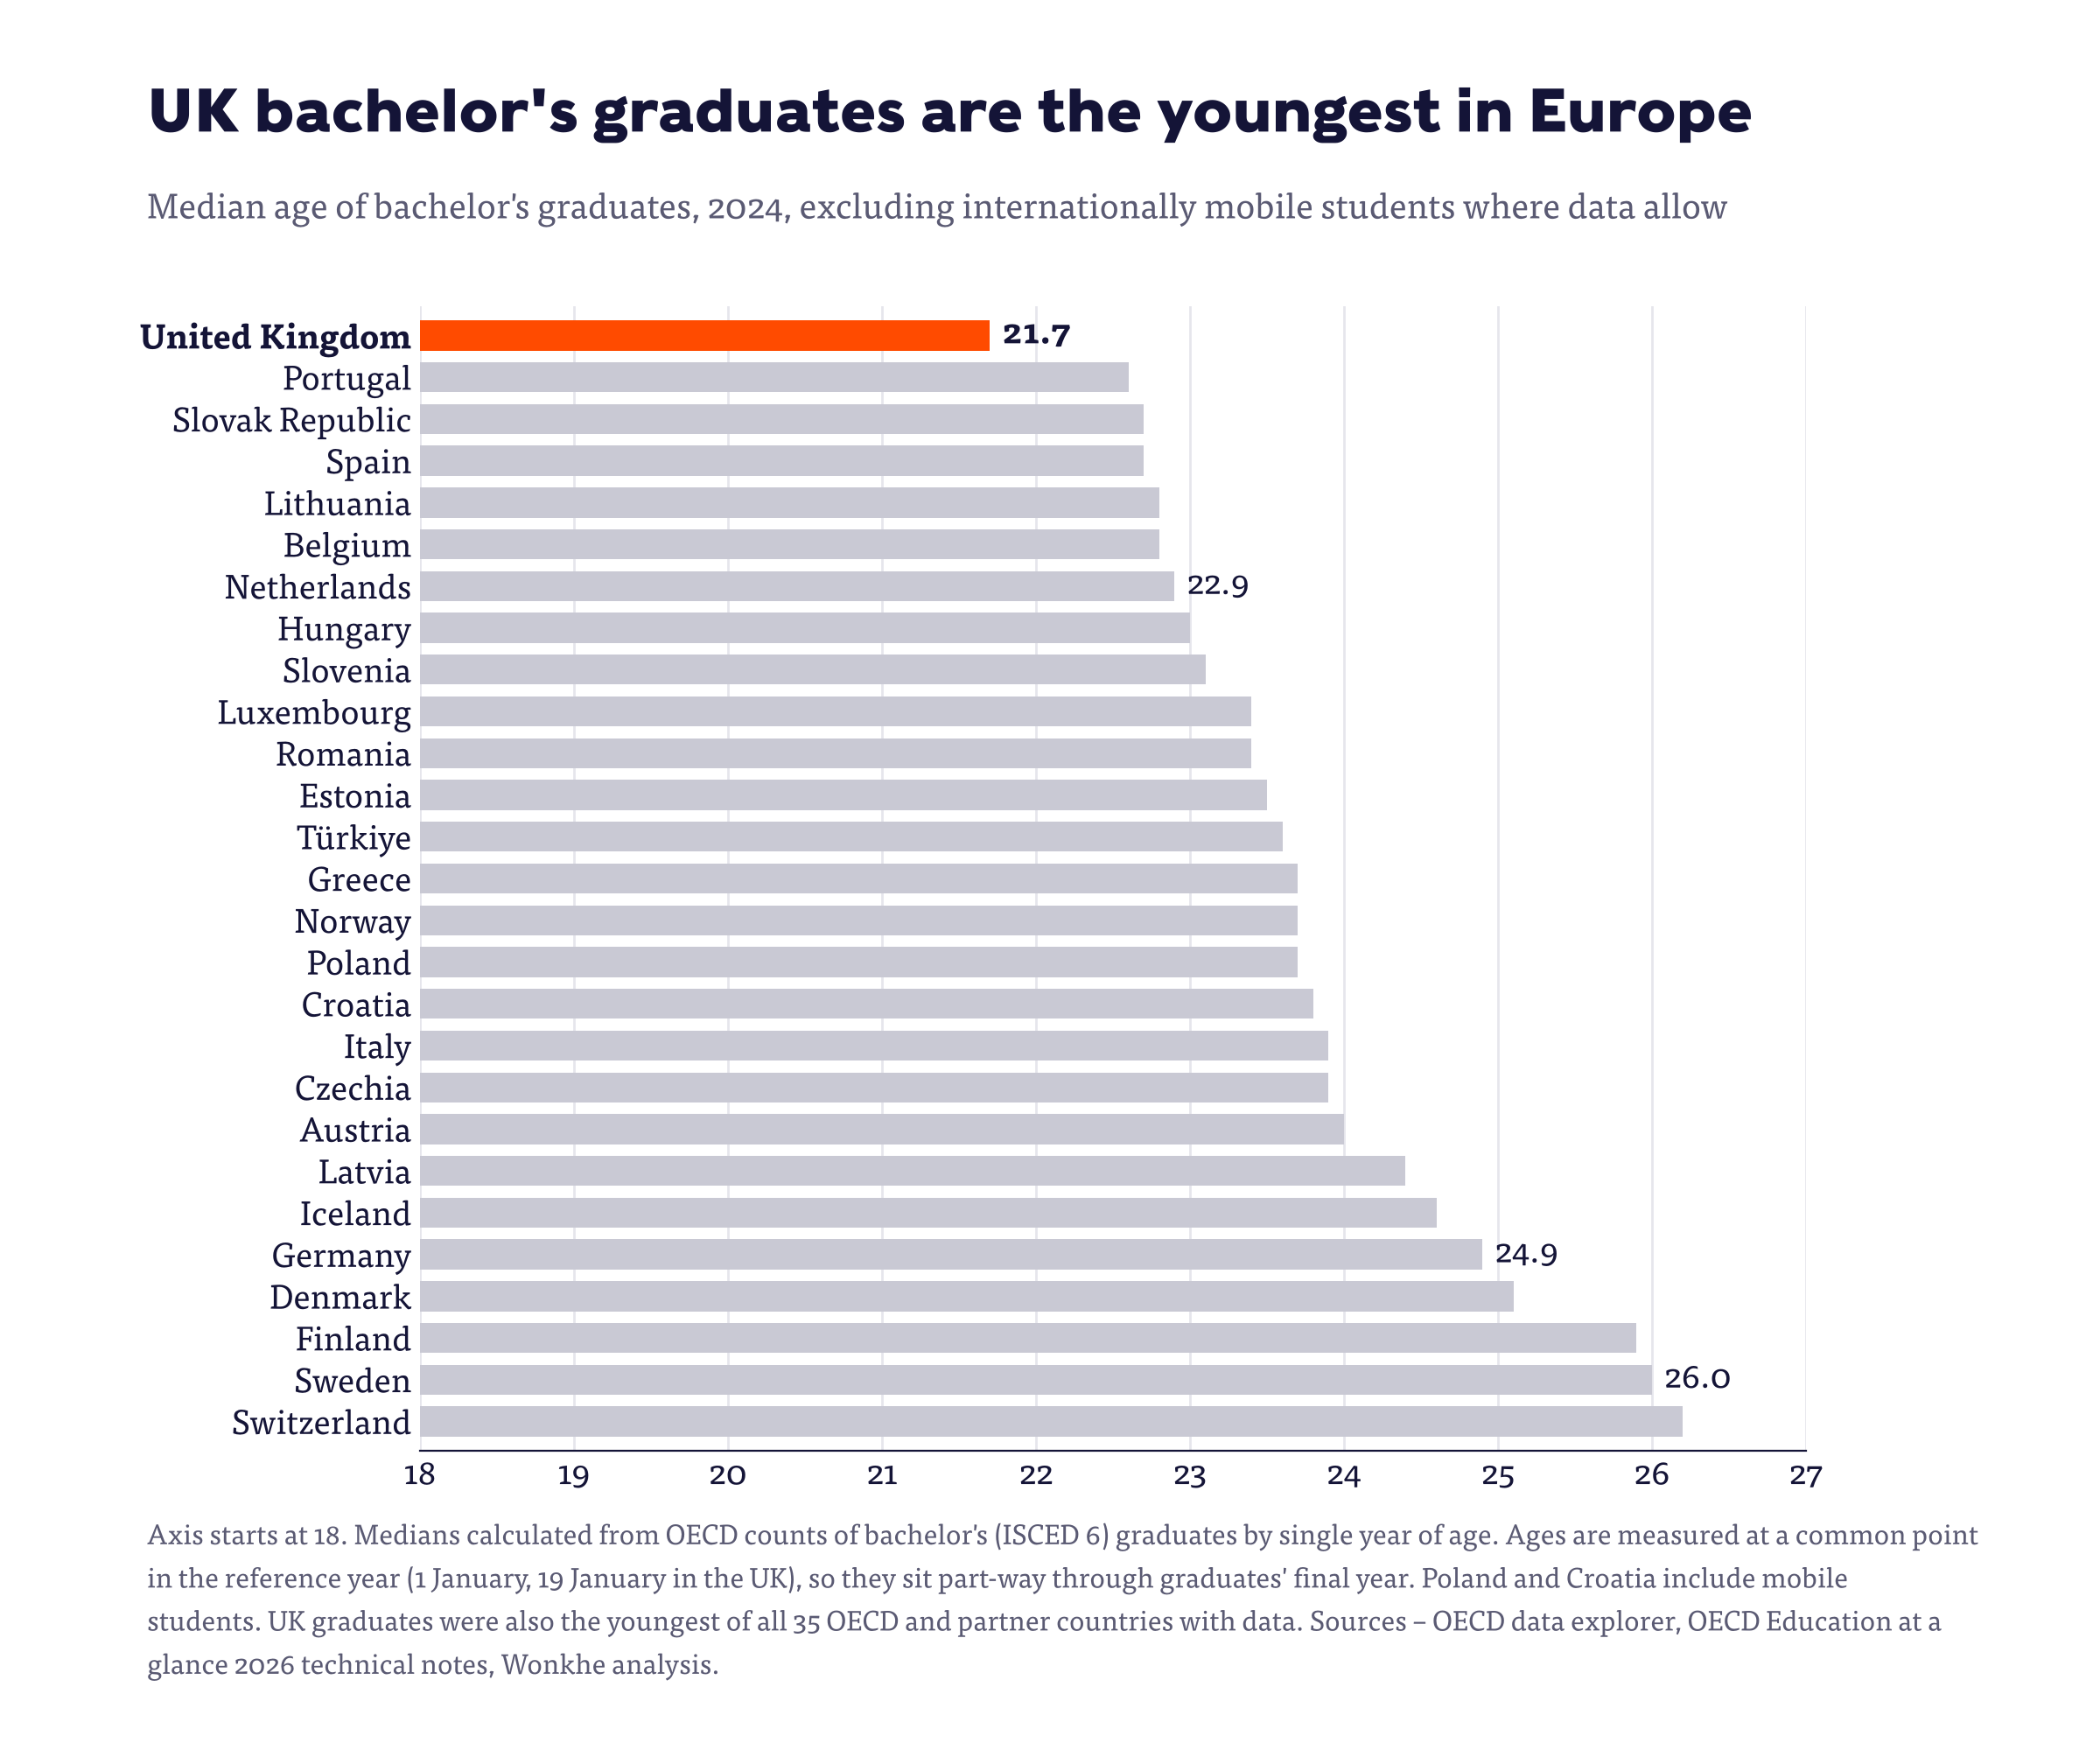
The age data back that up – the median UK bachelor’s graduate is 21.7, the youngest of any country with data despite Scotland in the mix, against 22.9 in the Netherlands, 24.9 in Germany, and 26 in Sweden.
Once you allow for the OECD measuring everyone’s age part-way through the year, a typical UK graduate takes around 3.4 years from entry to graduation, against around 4.7 for the median European system.
Run the completion rates through a simple cohort model and the UK needs somewhere between a fifth and 30 per cent fewer funded student-years to produce each graduate than the OECD average.
Where that leaves us
Add all of that up and the picture on teaching is very different from the one in the headline table.
TRAC puts the full cost of teaching in England and Northern Ireland at £21.7bn – scaled roughly to the UK, that is about £10,200 per student, or around $15,500 at the OECD’s exchange rate. The OECD average for spending excluding R&D is $15,470.
In other words, on the best evidence available, the UK spends an almost exactly average amount teaching each student each year – and because our students get through faster, somewhere between 20 and 30 per cent less than the OECD average per graduate.
The headline lead mostly reflects fee income, much of it from international students, being spent on research, commercial activity, and capital rather than on the students paying it.
That’s my estimate rather than an OECD one, and it leans on TRAC’s full economic costing, which if anything flatters teaching spend. But it’s a long way from “unis are swimming in it”.
And while we’re in there
Universities don’t fit their own label
The OECD classes every UK university as a “government-dependent private institution”, a category defined as receiving 50 per cent or more of its core funding from government.
In 2023 UK universities don’t meet that test on any basis – government’s share of their income is 22 per cent on the headline measure, and 42 per cent even if you count tuition fee loans as government money.
Back in 2015 the loans-included figure was 52 per cent. The label is a hangover nobody seems to have revisited, and on the OECD’s own definition UK universities would now be independent private institutions. Ugh.
What the public really chips in
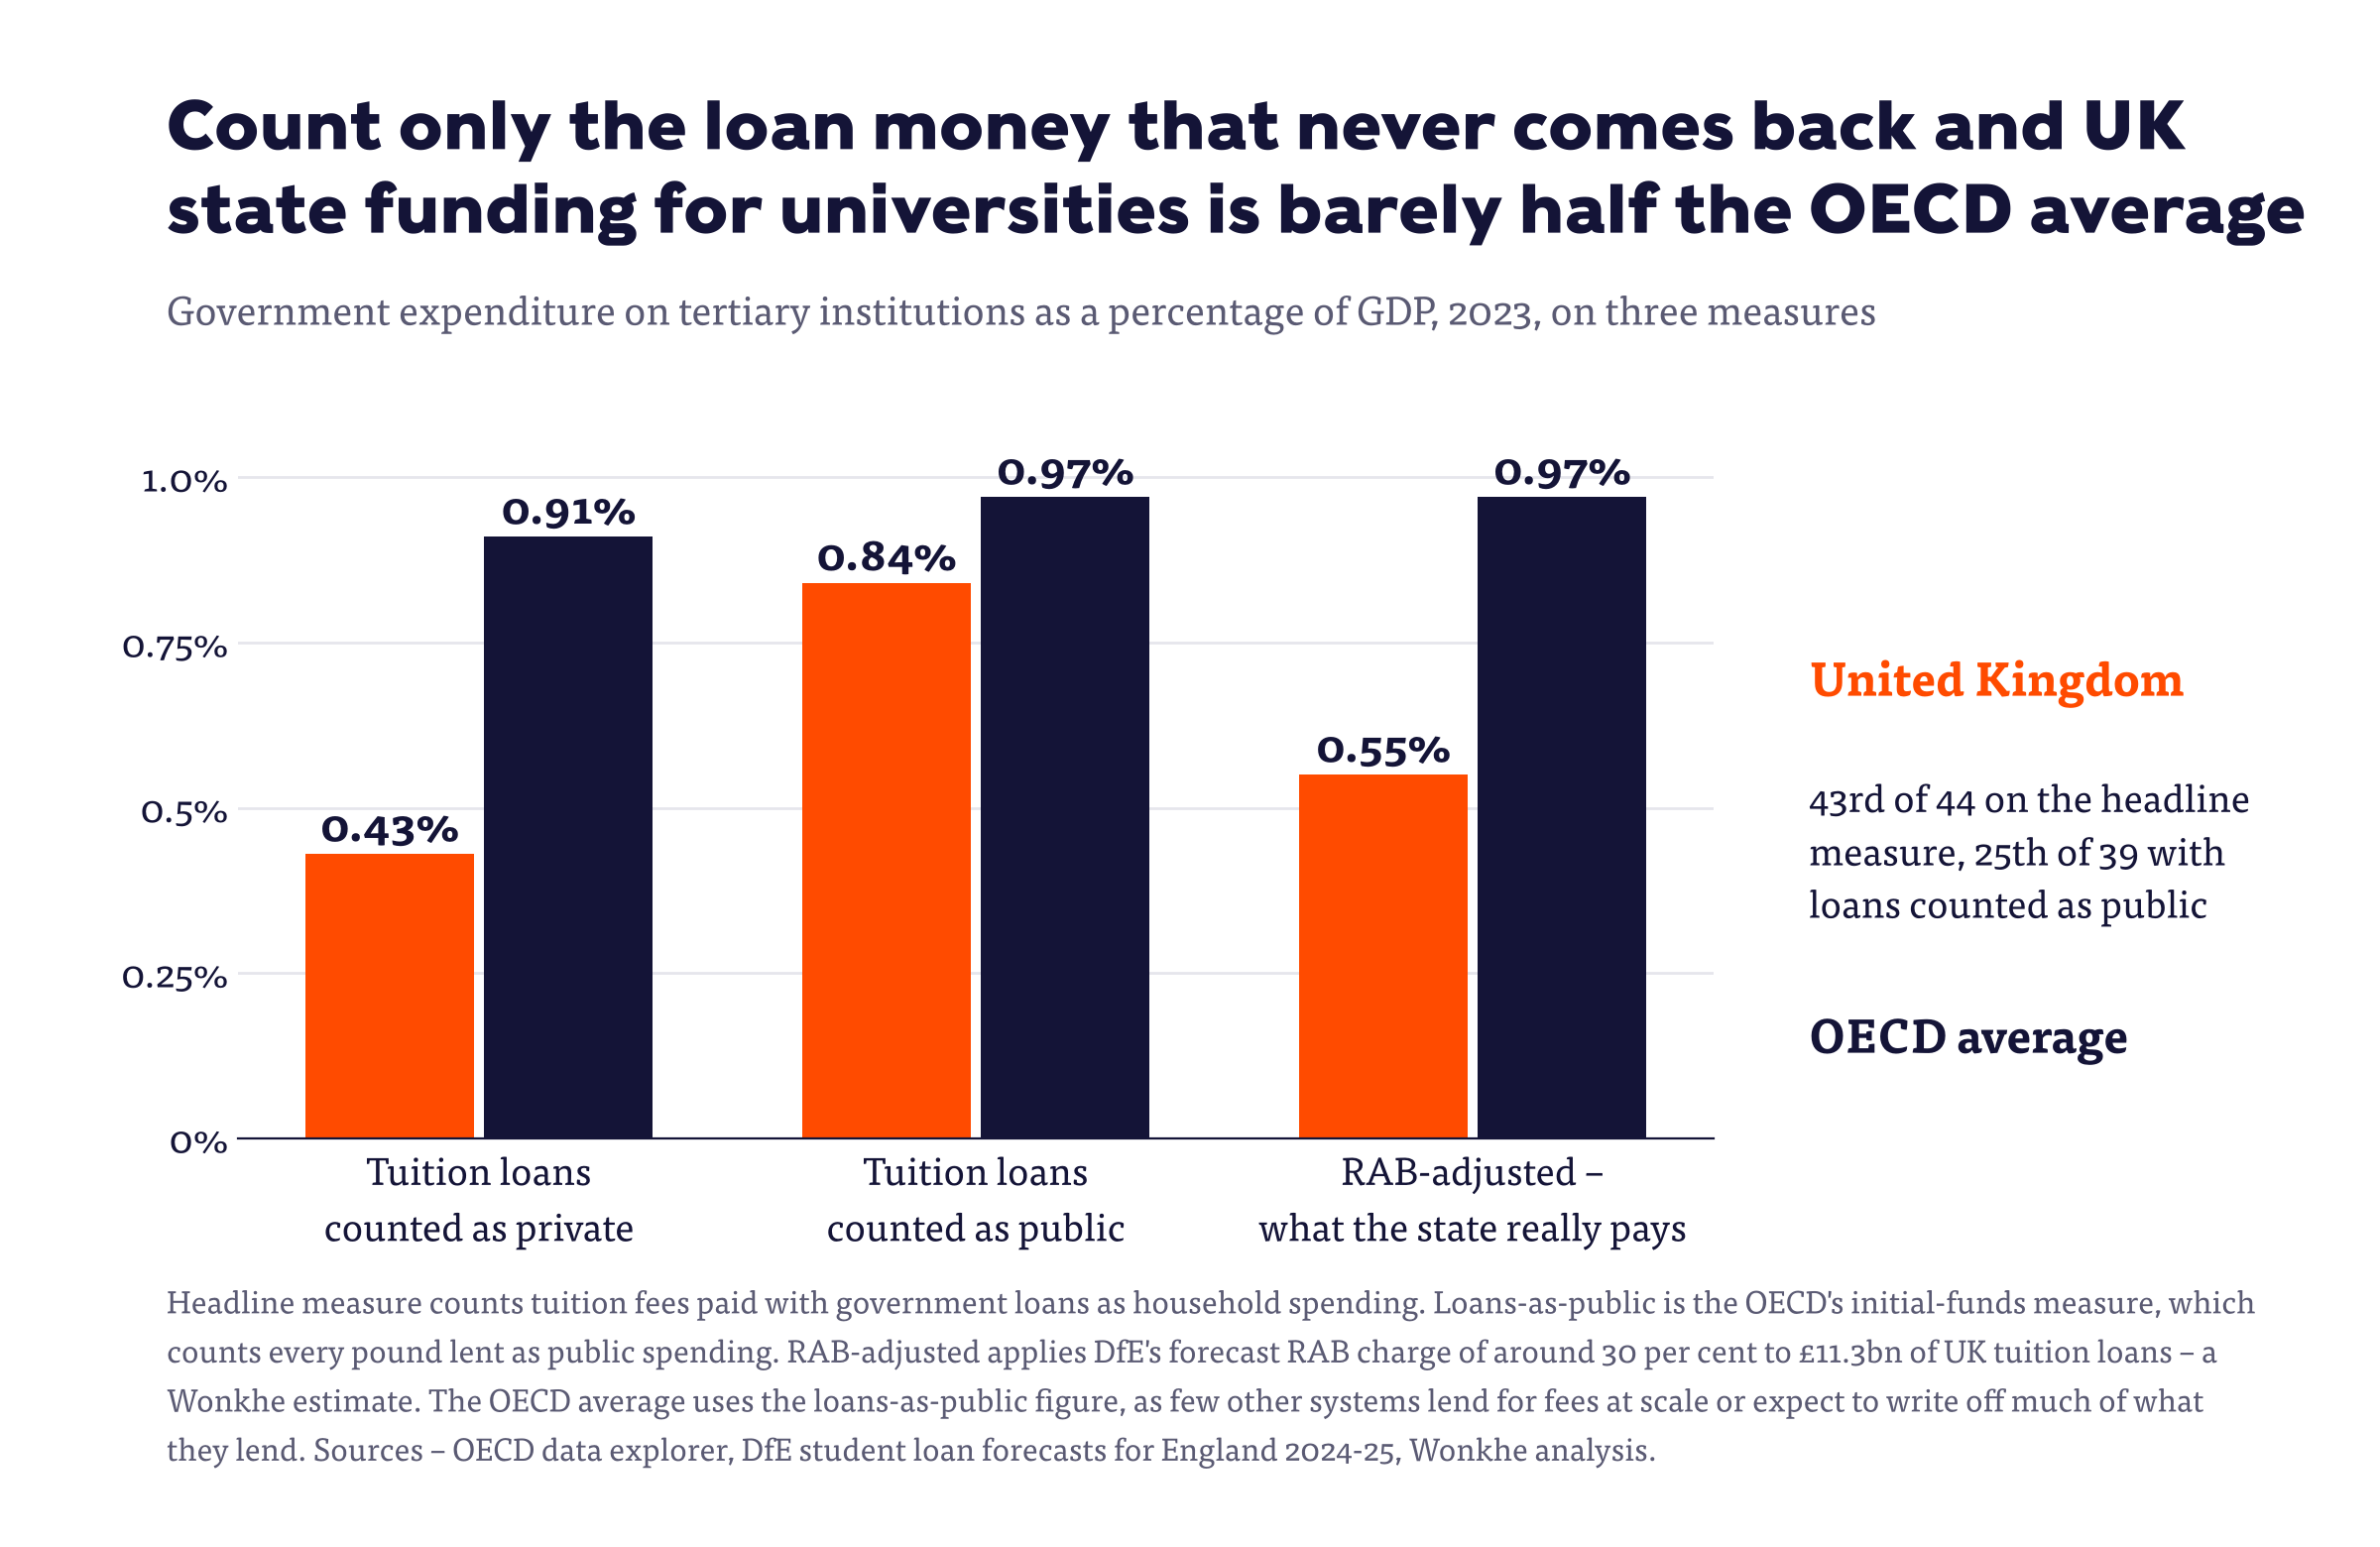
On the headline measure, UK government spending on tertiary institutions is 0.43 per cent of GDP, 43rd out of 44 countries, ahead of only Luxembourg.
But that’s an accounting convention – it counts a tuition fee paid with a government loan as household spending. The OECD’s own alternative measure moves the loan back to government and puts the UK at 0.84 per cent of GDP against an OECD average of 0.97, 25th of 39 and level with Australia.
Neither is the real public cost. Apply DfE’s RAB charge of around 30 per cent to the £11.3bn of tuition loans and government ultimately bears about 28 per cent of university income, or something like 0.55 per cent of GDP.
That still leaves the UK near the bottom of the table on what the state puts into teaching.
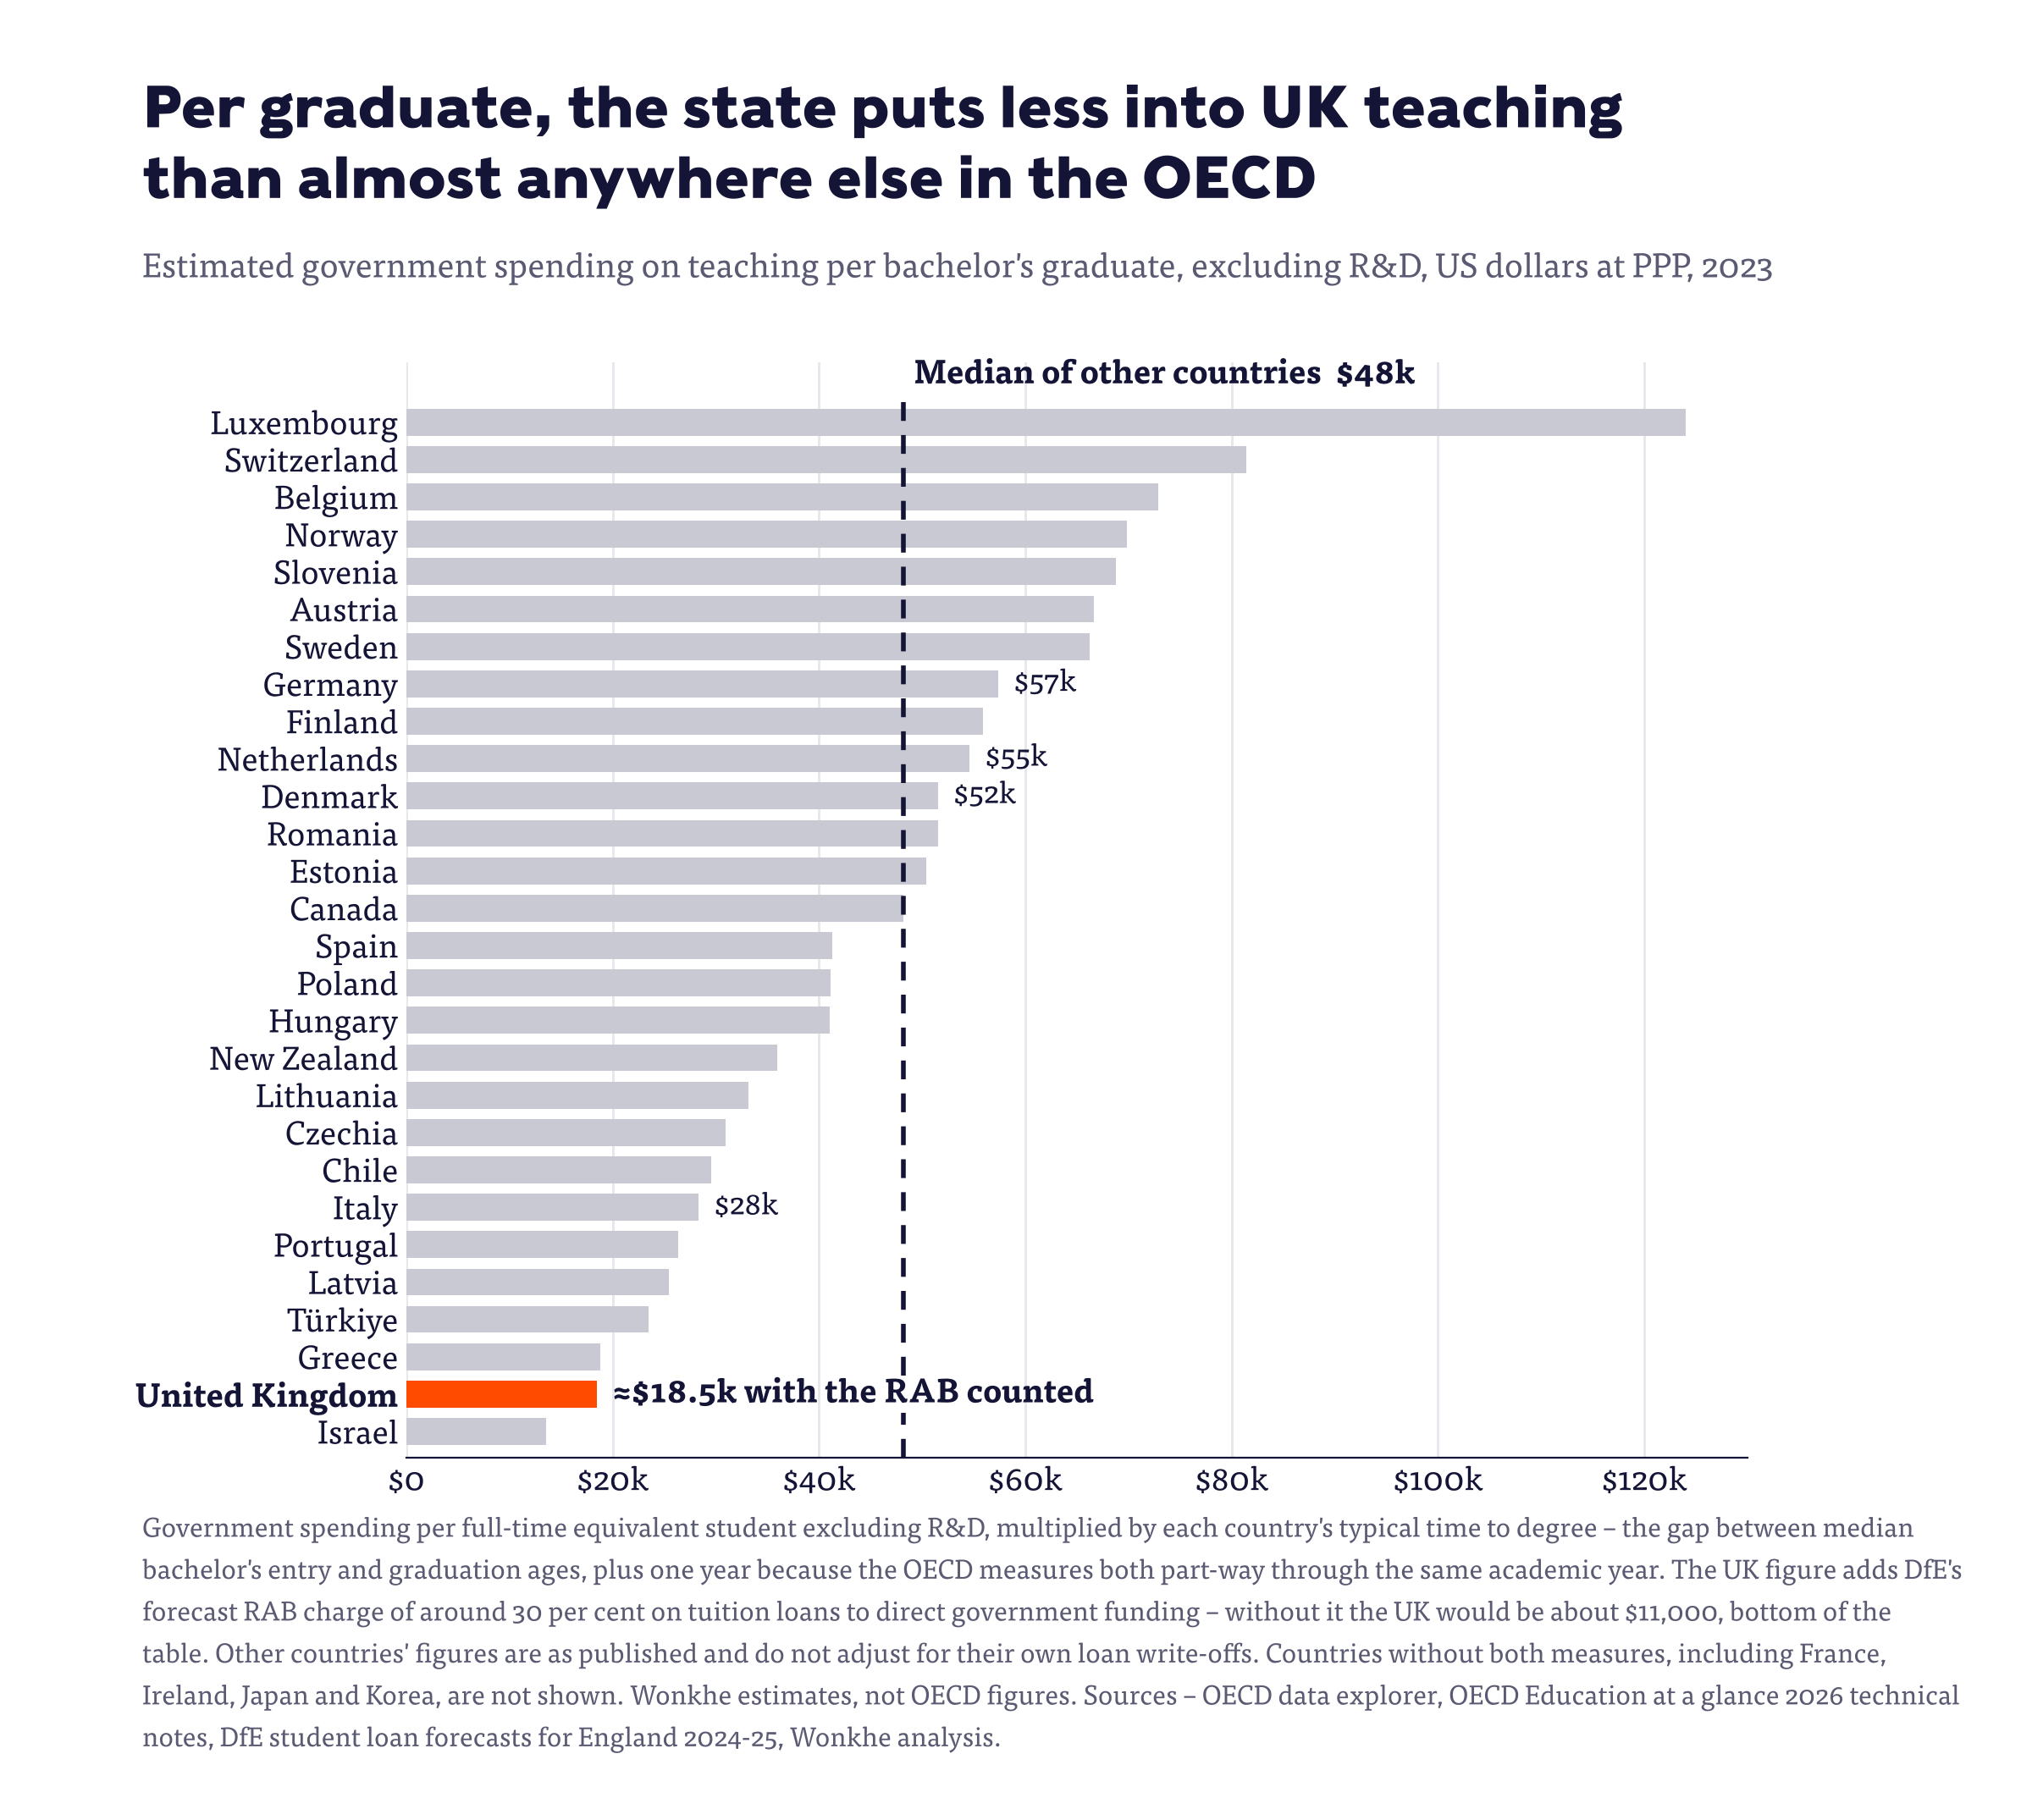
Strip out R&D and add the RAB back, and government money per UK student comes to about $5,360 a year against an OECD average of $10,490 – 29th of 33, ahead of only Chile, Greece, and Israel.
And because our degrees are short, the savings land almost entirely on the public side of the excel sheet – public spending per UK graduate comes out at around $20,000, against somewhere between $49,000 and $56,000 across the OECD, roughly two-fifths of the average.
The staff cost collapse
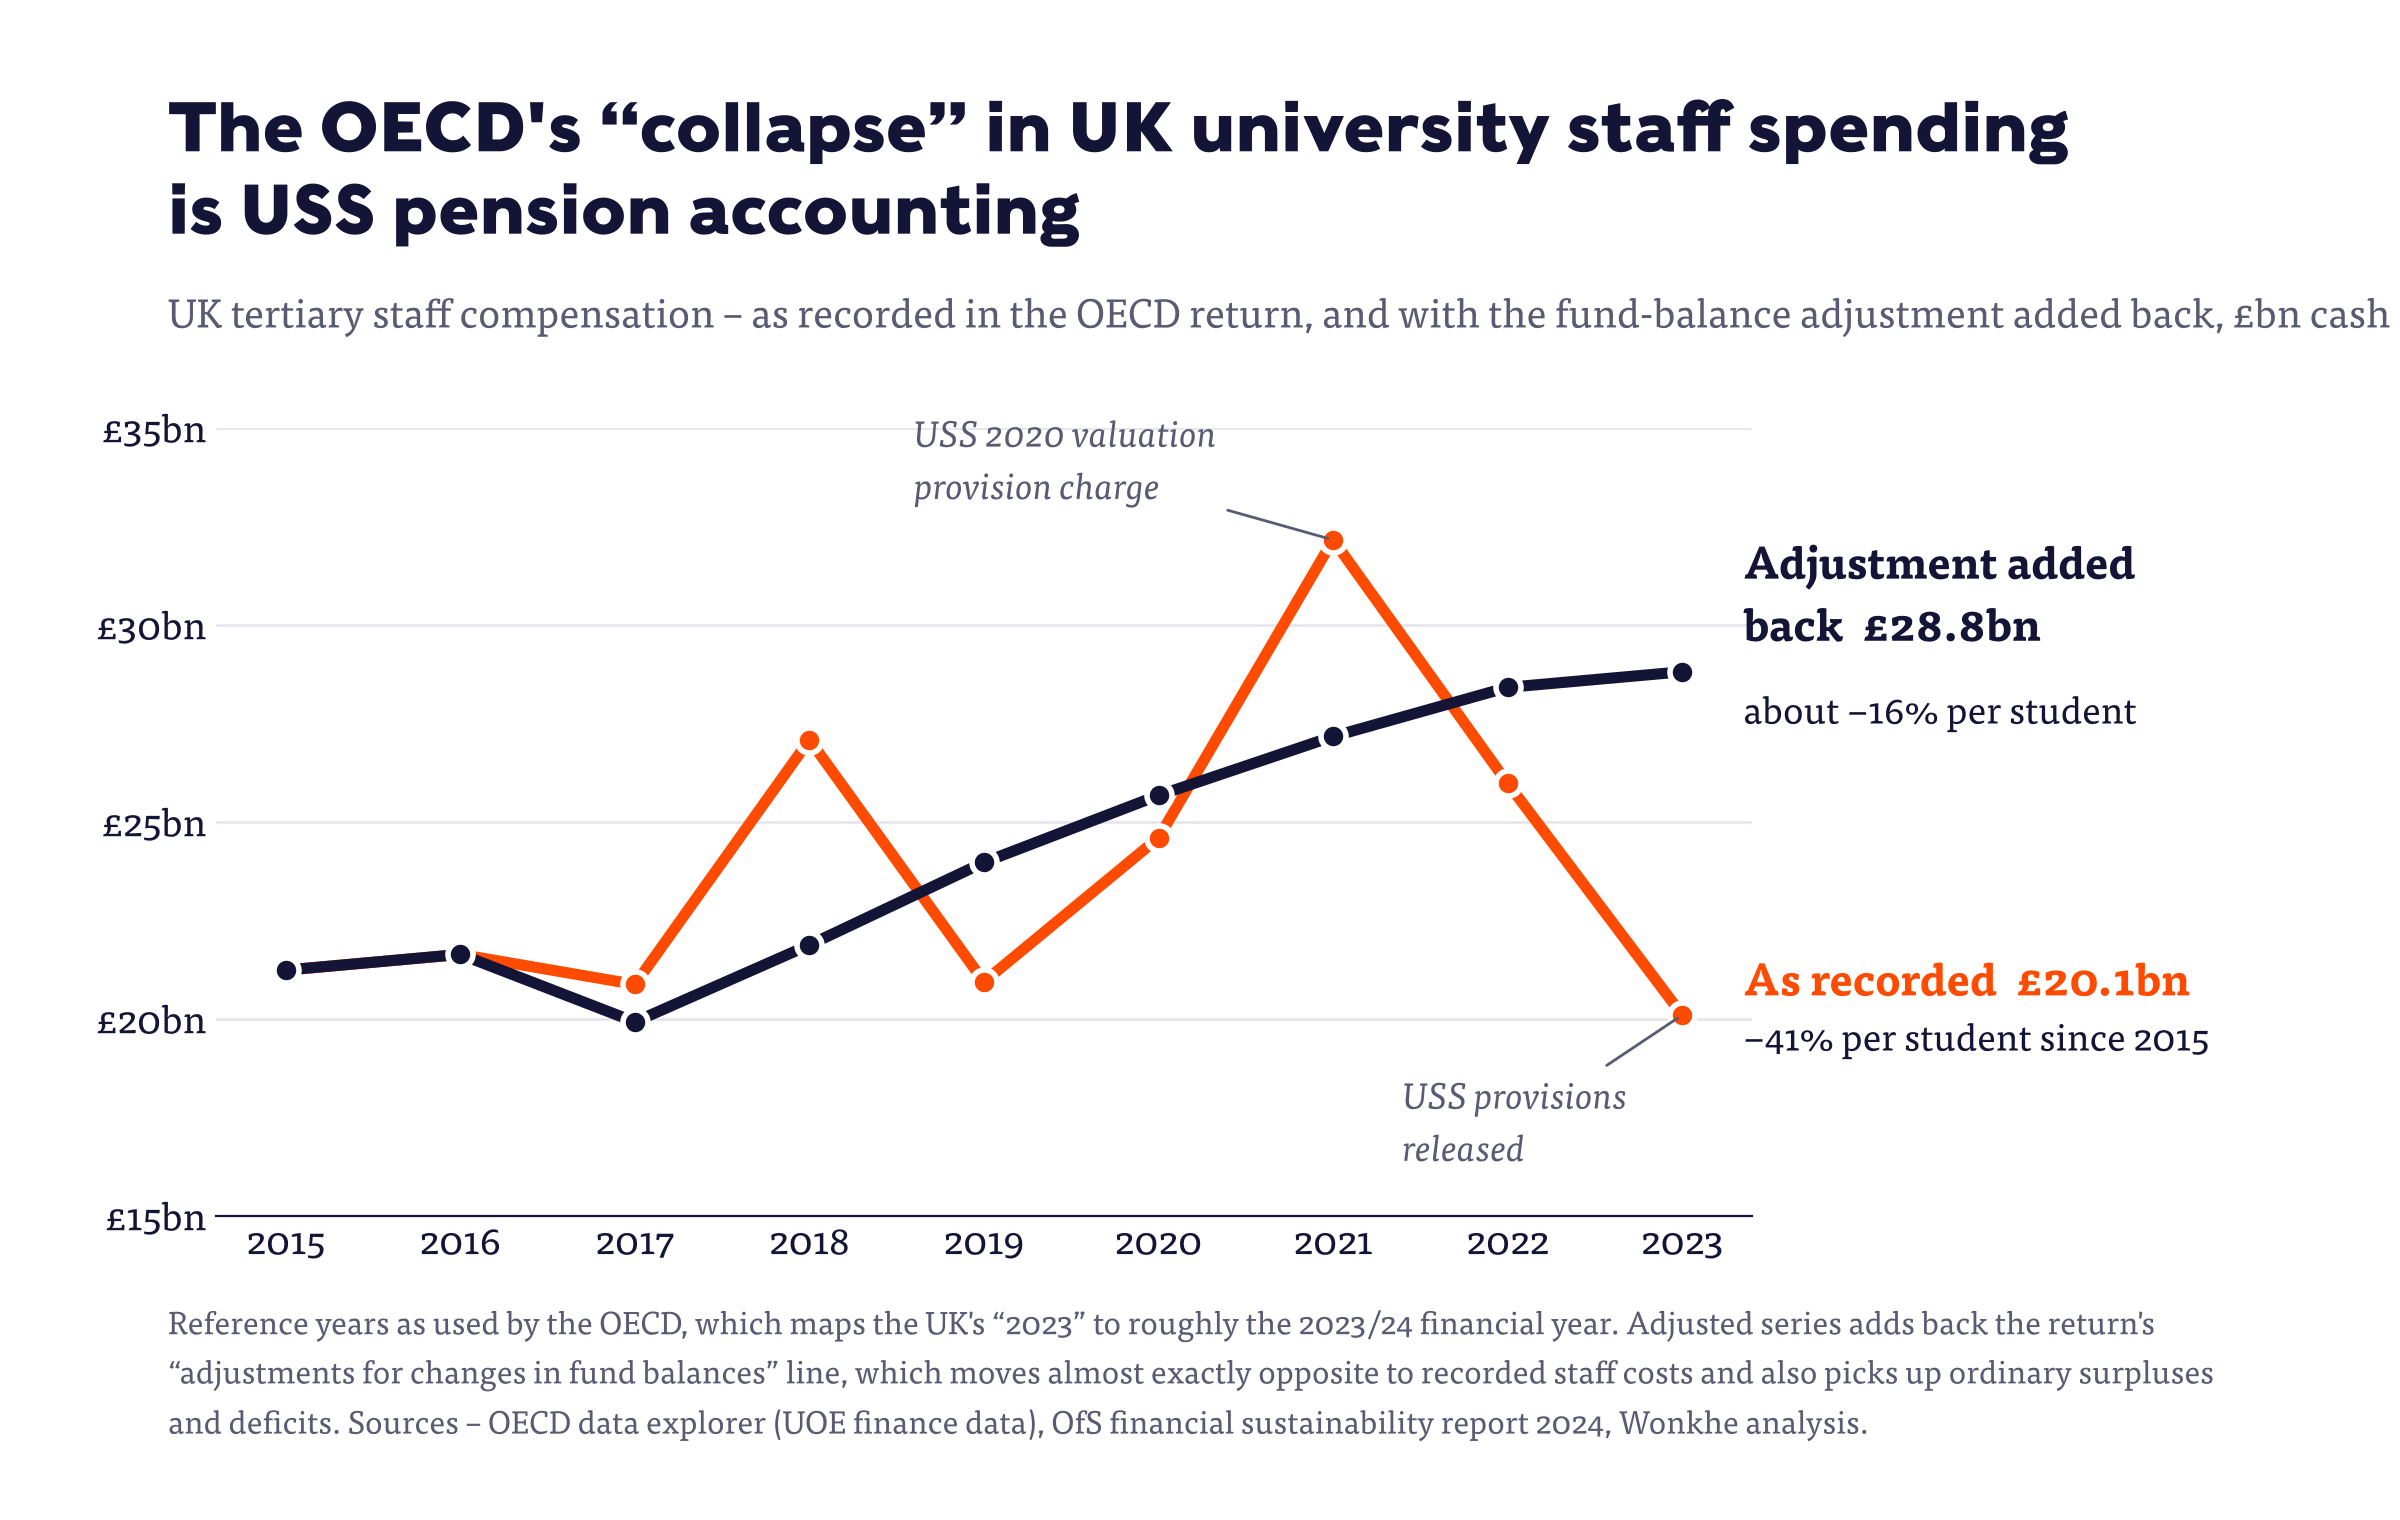
Buried in the finance chapter is a 41 per cent real-terms fall in UK tertiary staff spending per student between 2015 and 2023, which the OECD itself calls “surprising”.
The annual series explains it – recorded UK staff compensation leaps to £27.1bn in 2018 and £32.2bn in 2021, then crashes to £20.1bn in 2023, less in cash than in 2015.
That’s not a workforce, it’s the USS provision cycle, mirrored almost exactly by that fund-balance adjustment line. Add the adjustment back and staff compensation rises smoothly to £28.8bn in 2023, and the real fall per student is closer to 16–20 per cent – a real squeeze driven by student numbers growing faster than staffing and pay being eroded, but not the collapse the table shows.
The graduate premium
Young UK bachelor’s graduates earn 42 per cent more than people whose highest qualification is upper secondary, comfortably above the OECD average of 31 per cent.
But the premium doesn’t grow with age the way it does elsewhere. Across the working-age population it’s 35 per cent against an OECD average of 54 per cent – and the distribution is compressed, with only 14 per cent of UK graduates earning more than twice the median against 22 per cent across the OECD.
Part of the story is the comparison group. UK workers with general upper secondary qualifications earn 23 per cent less than the national average, and those without them 48 per cent less, against OECD gaps of 13 and 31 per cent.
A degree in the UK is a strong insurance policy against low pay, but a much weaker ticket to high pay than in most of the OECD – which is the profile you’d expect from a system where DfE thinks around 30 per cent of loan outlay will never come back.
How vocational and STEMmy are we?
One final observation. Compared with most of the OECD, the UK is light on vocational qualifications at school level, about average on STEM at degree level, and heavy on arts, humanities, and social sciences.
Only 15 per cent of UK 25–34 year-olds hold a vocational upper secondary qualification as their highest level, against 21 per cent across the OECD and 30 per cent in the EU.
Among UK bachelor’s graduates, 24 per cent studied STEM subjects, against an OECD average of 23 per cent – but 32 per cent studied arts, humanities, social sciences, or journalism, against 22 per cent across the OECD.
And among international graduates from UK institutions, 43 per cent qualified in business, against 26 per cent of international graduates across the OECD – so the money cross-subsidising all that research is coming, in large part, from business master’s courses.
The real picture
So on the headline chart, we appear to spend far more per student than almost anyone else while asking the state to put up far less of it than almost anyone else.
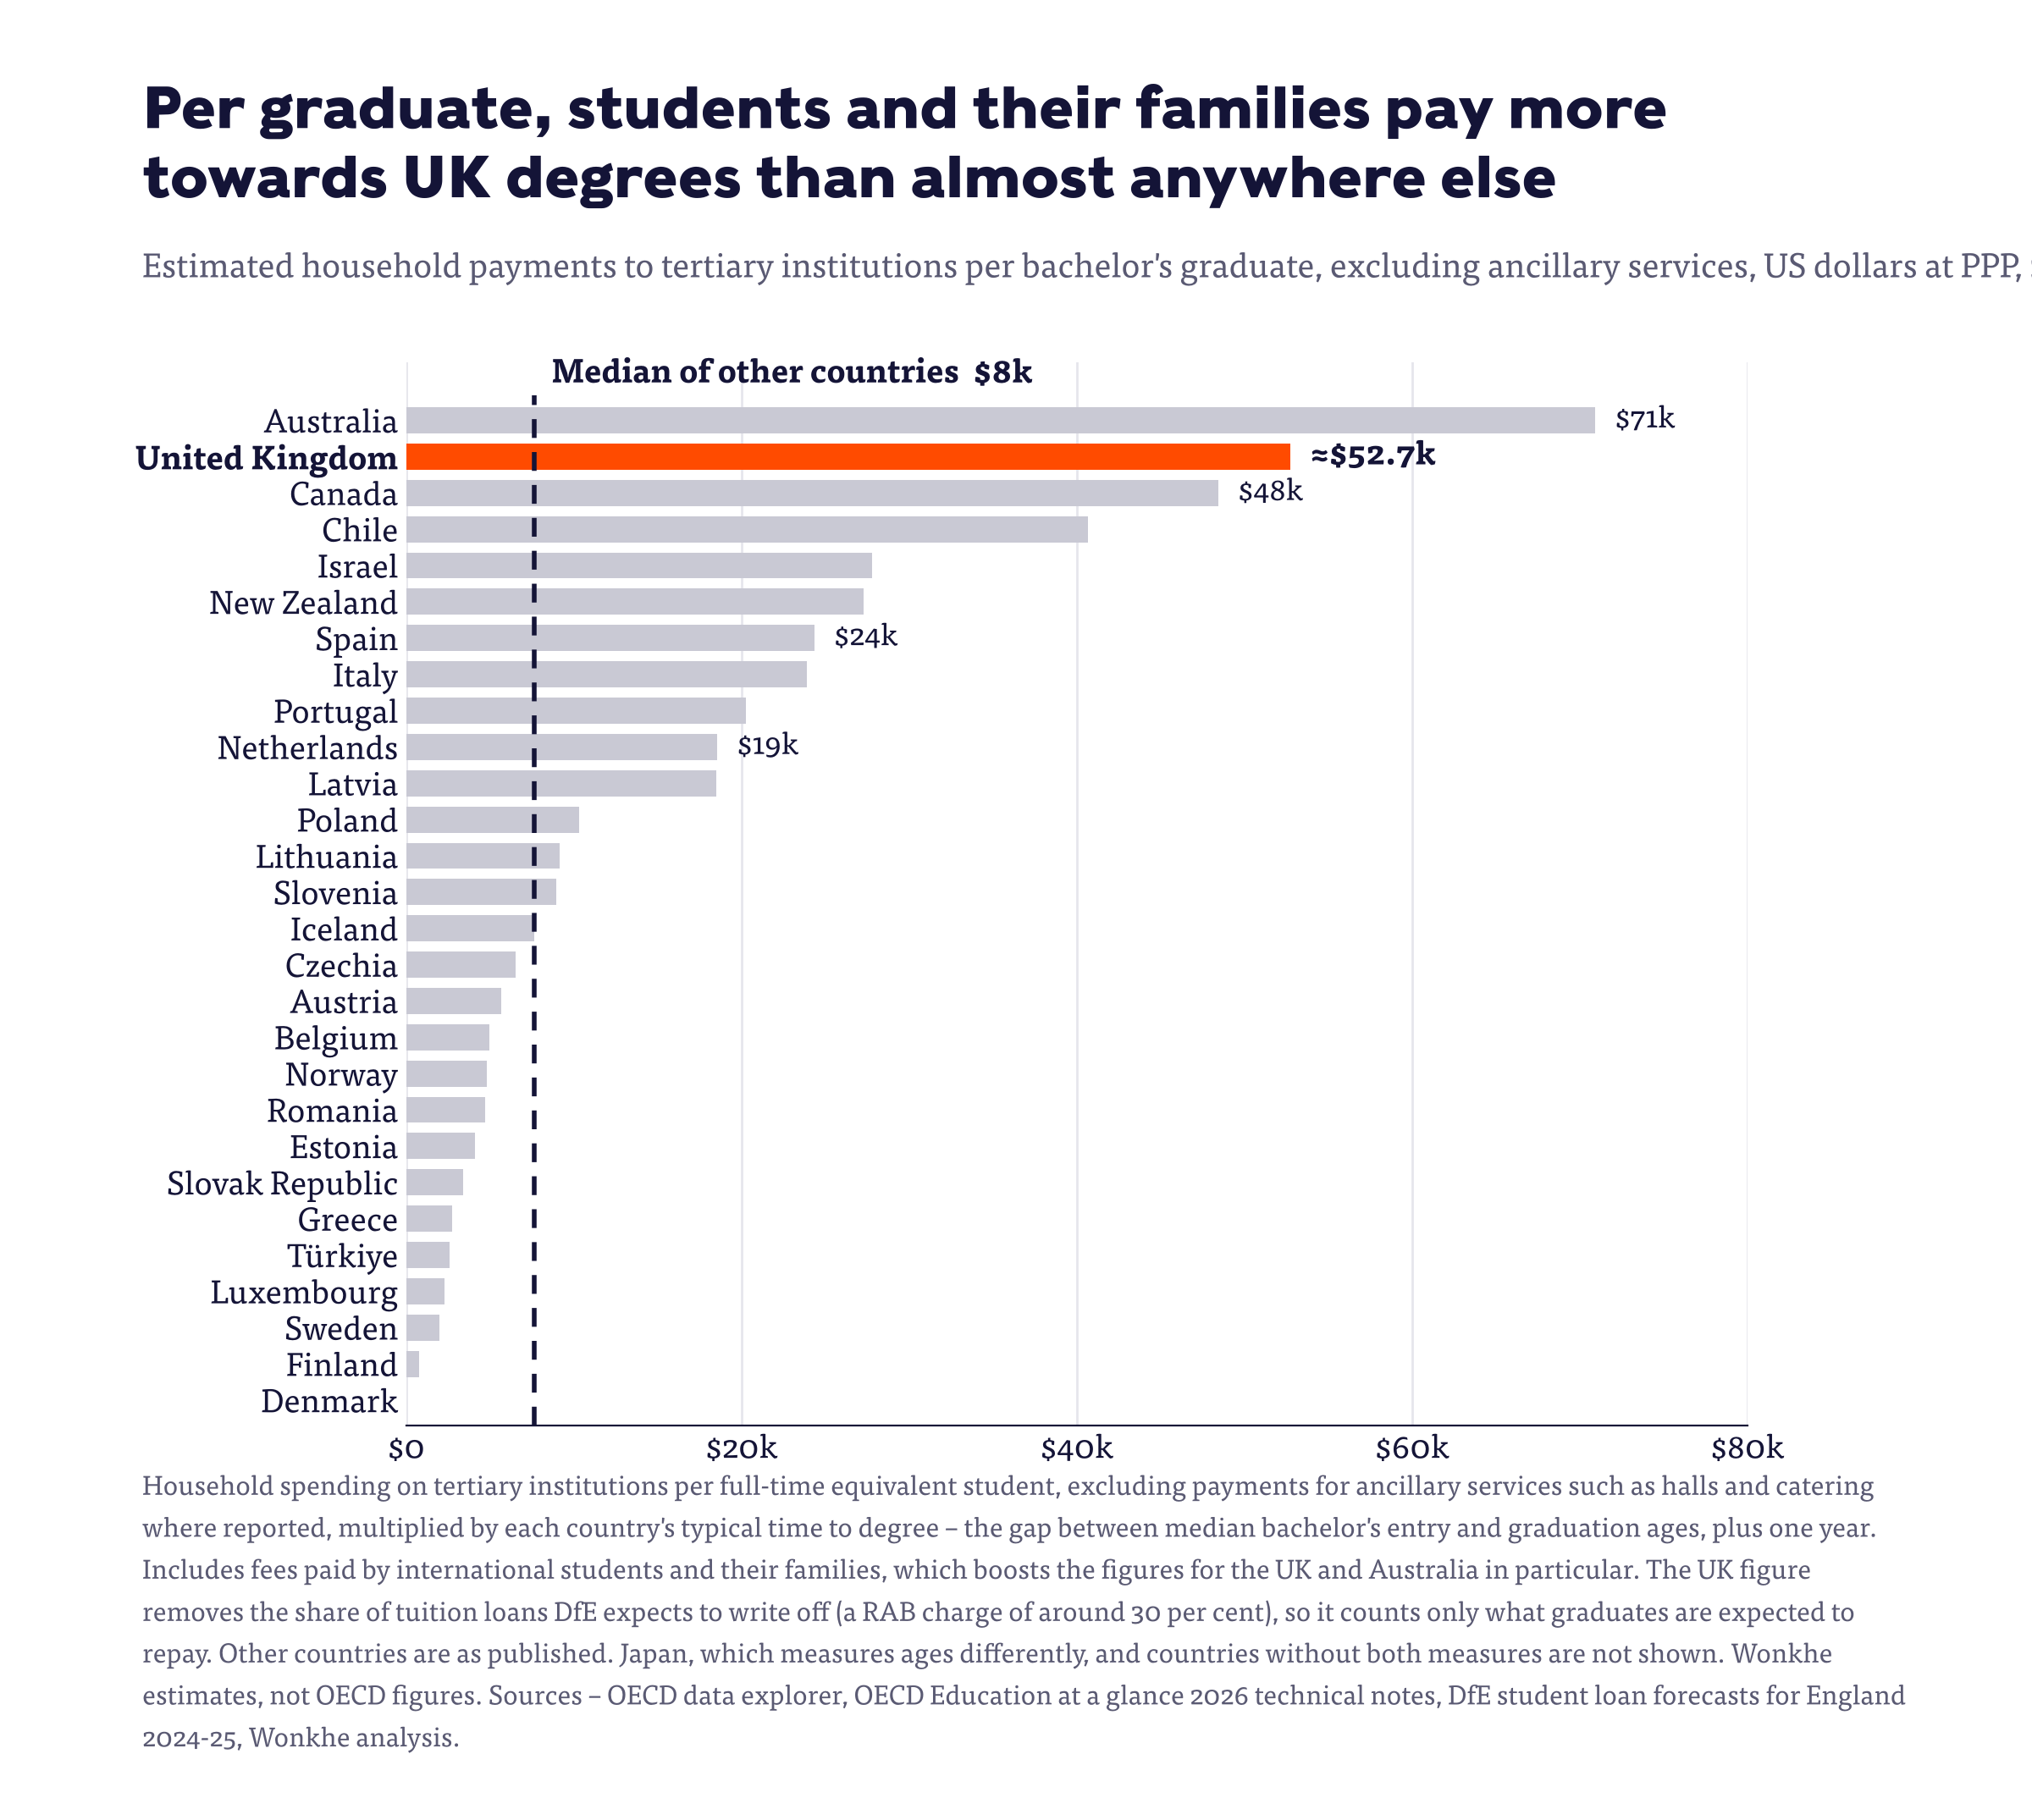
In reality we spend about the same per student as everyone else, and less per graduate – the state puts in far less than almost anyone else, and students and graduates put in far, far more. And this chart doesn’t even start to get into living costs:
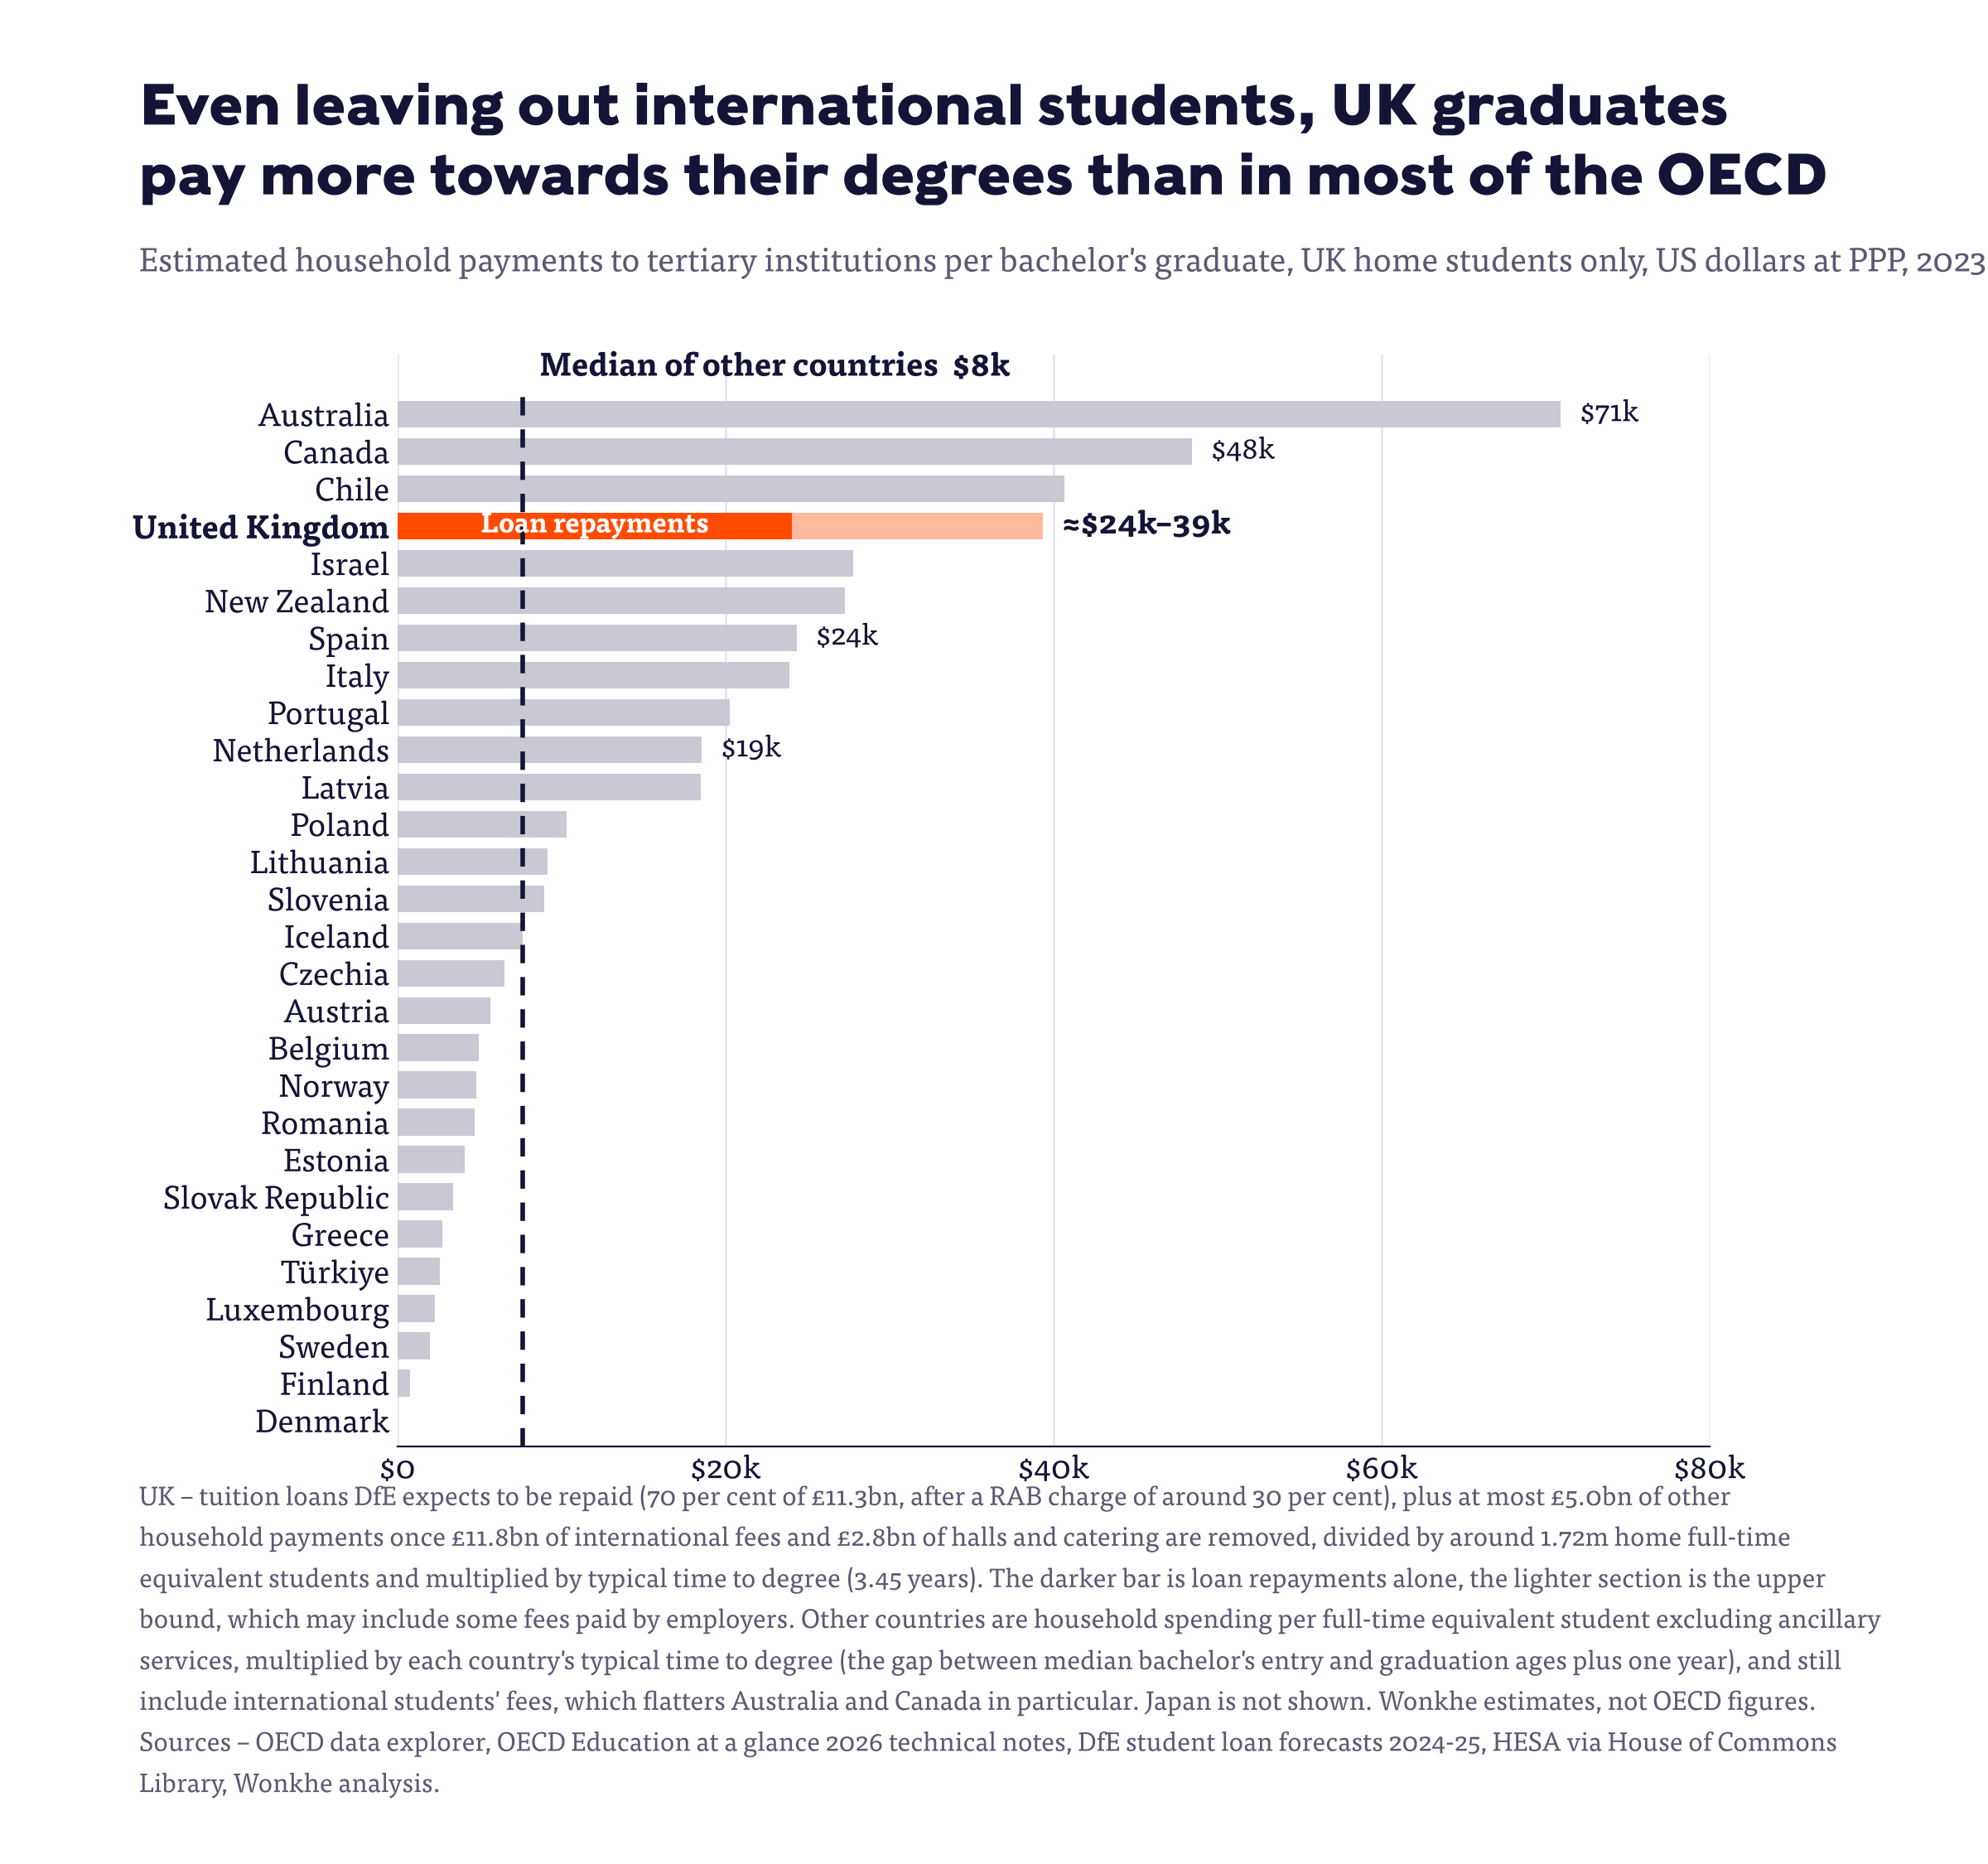
The problem with that is the graduate premium we saw earlier – well above the OECD average for young UK graduates, but well below it across the working-age population.
Elsewhere the payoff from a degree tends to grow over a career, while here (on a snapshot, at least) it shrinks, just as graduates on 30 and 40-year repayment terms are expected to keep paying.
Asking graduates to put in far more than almost anyone else only adds up if the premium keeps rising, and when it doesn’t, the bill should drift back to the state through the RAB charge. Instead, the Treasury fiddles with terms so that it lands on middle earners paying for decades for a premium they increasingly don’t get.
None of which will stop the headline chart turning up in a Treasury slide deck.
But if it does, someone ought to be ready to explain that the UK’s apparent generosity is mostly fees being recycled into research, a pension accounting quirk, and a three-year degree that the OECD’s annual tables were never designed to measure.