

HESA Staff data 2021 full release
David Kernohan is Deputy Editor of Wonkhe
Tags
Though we got sector level data earlier in the spring, today’s release represents the first time we can see data on contract types and on how providers are growing or shrinking at a provider level. Let’s get into it.
Contractual obligations
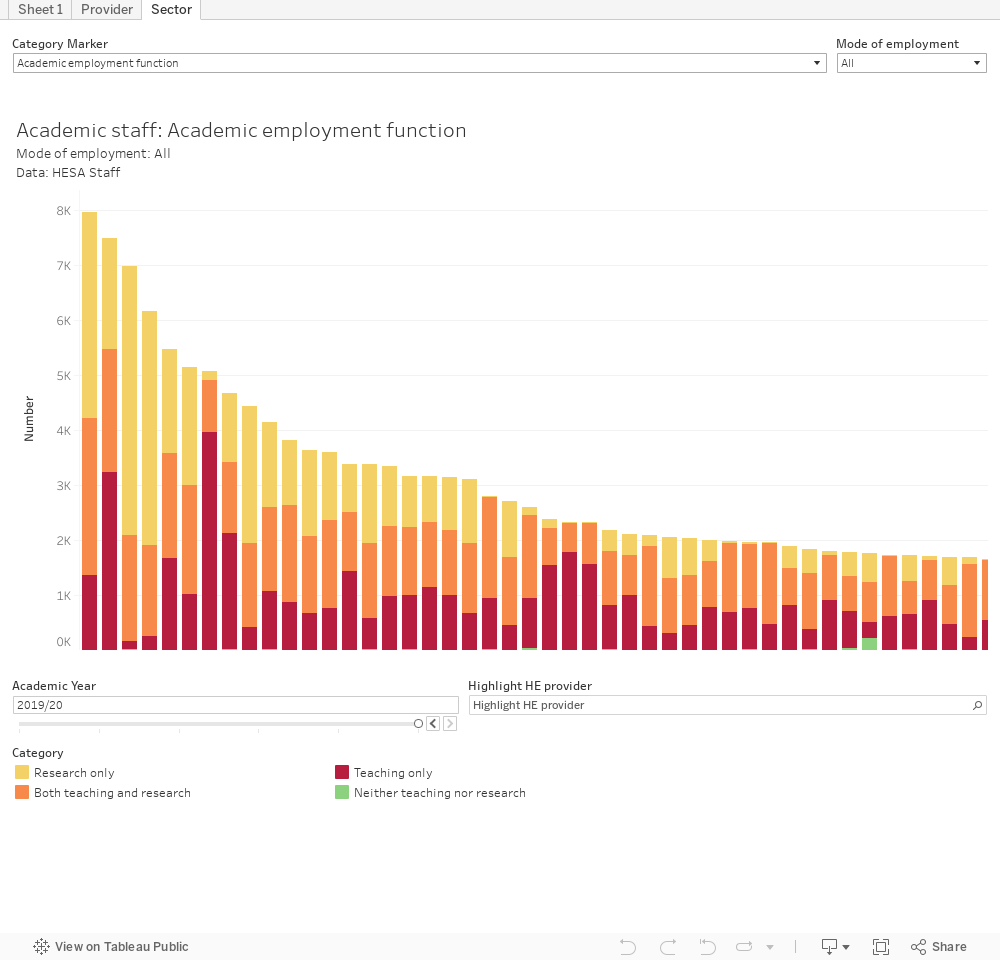
This first plot puts the sector in context. You can choose your statistic of interest at the top left (employment function, contract levels, sex, source of basic salary, terms of employment), set the mode of employment (part-time, full-time, all) on the top right, and travel through time or highlight providers of interest using the boxes at the bottom.
But this stuff really gets interesting at provider level, so I’ve put together a dashboard to show you all these stats over time for any provider in the system (use the box at the top to select)
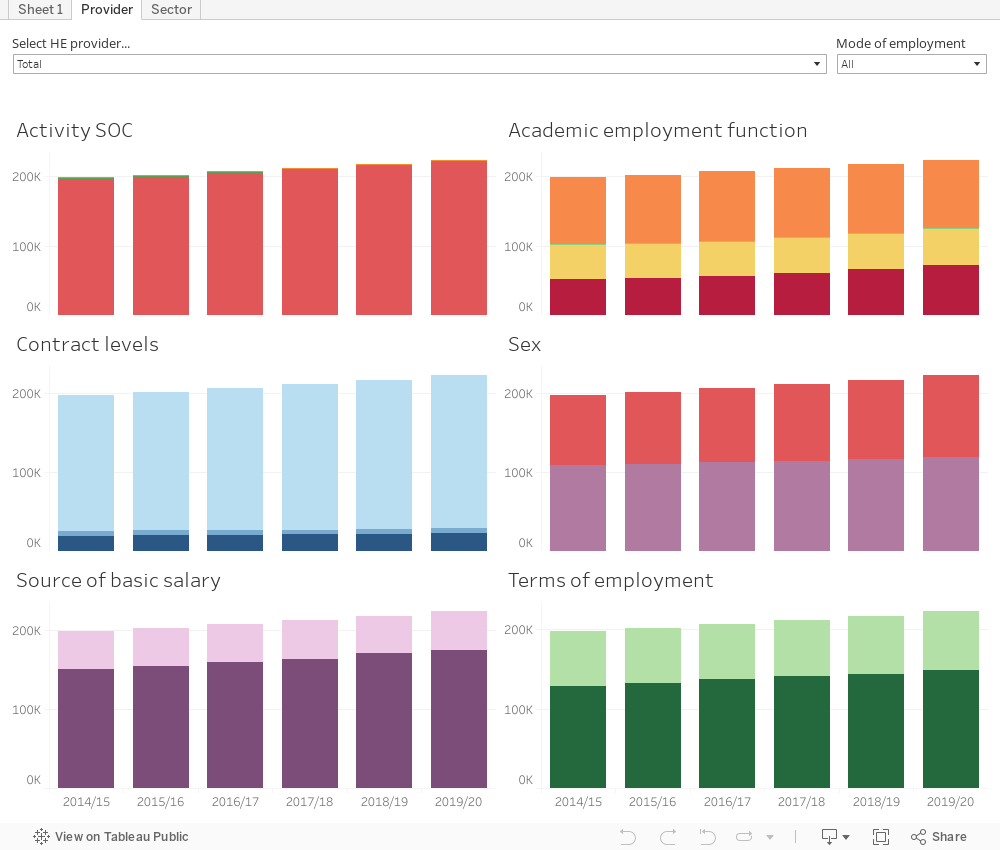
This defaults to looking at the whole sector in total, showing the gradual growth of the academic workforce through teaching only contracts and – to a less – pronounced extent, fixed term contracts (which are now about a third of all academic contracts). But every provider tells a story – there are some that looks to be addressing the needs of the academic precariat and some that are moving in a very different direction. You don’t need to look too far to find dramatic explosions of teaching only and fixed term roles.
Starters and leavers
The contractual terms of academics sit beneaths the wider issue of the growth or shrinkage of the academic workforce at each provider. Each year, people leave and new people join – a hugely nuanced phenomenon where we see experienced staff leave without replacement, swathes of new temporary staff take on teaching roles, and of course the converse – the places where providers are investing in their academic staff.
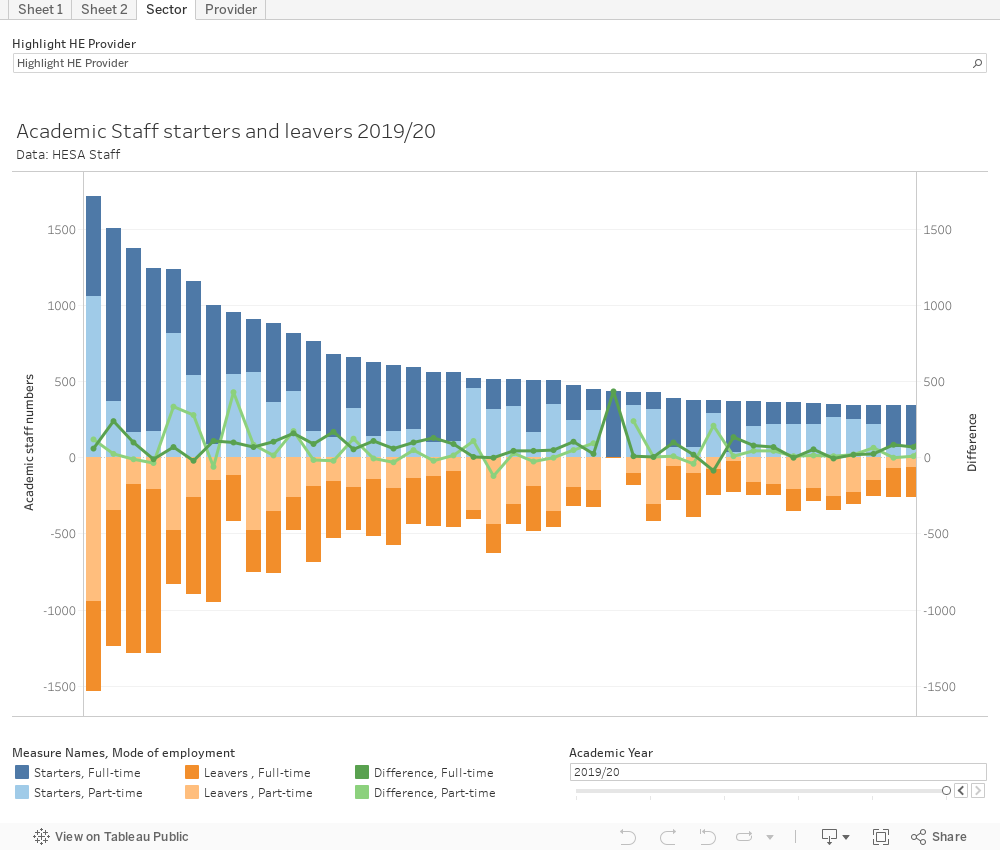
To start with here’s a look at the whole sector for 2019-20 (other years are available via the filter at the bottom left, highlight a provider of interest with the box at the top). The orange bars move down from zero and show leavers, the blue bars show starters (the census date is 1 December each year). I’ve used gradations to show full and part time staff, and the green lines show the differences between the full- or part-time starters and leavers.
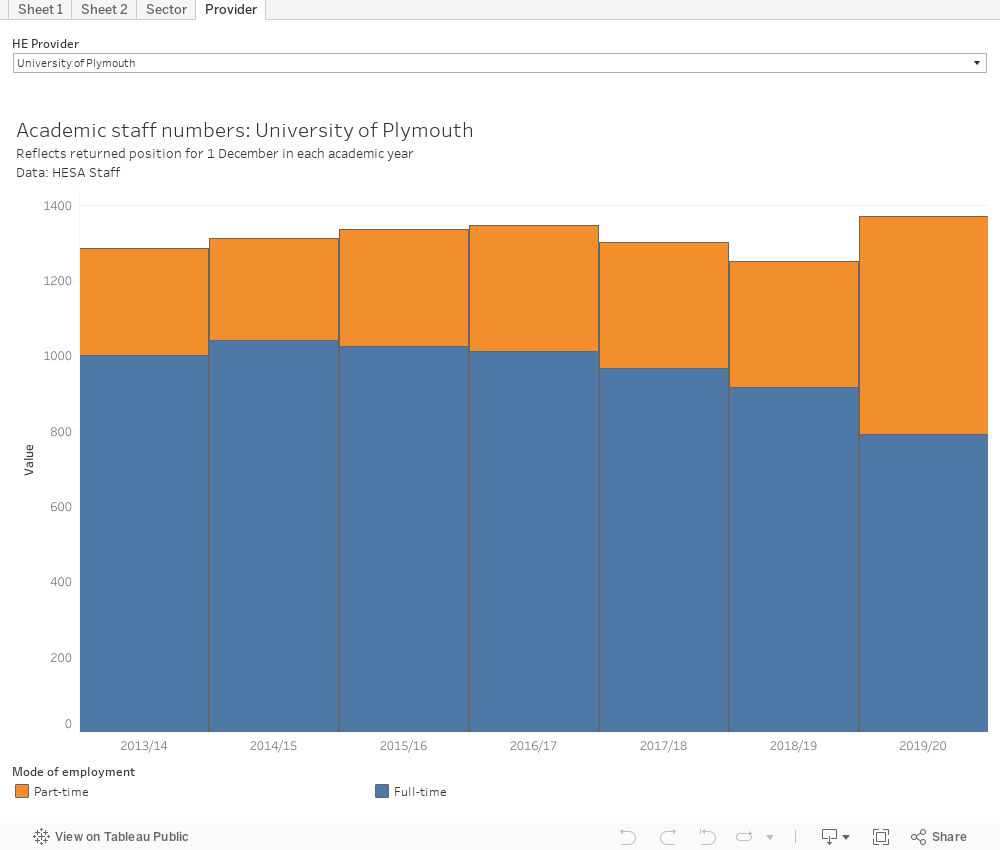
And yes, I have overall numbers for full and part-time staff at each provider as a time series – use the box at the top to choose your provider of interest.
Last of the old order
All this is, of course, pre-Covid. If you think these numbers are interesting this year, next year will be utterly fascinating and more than a little depressing.
If you’re wondering about non-academic staff – well, the Office for Students don’t think non-academic staff are important enough to mandatorily feature in HESA data returns. It’s odd really, you’d think for a regulator concerned with bureaucracy there may be some residual interest in the number of staff that spend large parts of their working lives dealing with it – and on a civic level, universities as local employers is a case that needs to be made right now.