

HESA has a new area-based measure of deprivation
David Kernohan is Deputy Editor of Wonkhe
Tags
There’s a couple of basic issues with our existing measures of socioeconomic disadvantage used in higher education.
It’s fertile ground that we’ve been over before on Wonkhe, but suffice it to say that:
- Some of them (eg POLAR, TUNDRA) don’t actually include any information about deprivation – just on participation in higher education
- Others are less relevant in some parts of the UK, or are constricted in different ways in different places (IMD, WIMD, SIMD, NIMD)
The whole UK has (different but broadly comparable) goals around widening access to higher education among disadvantaged groups. But it is very difficult to make a comparison of progress across the UK, something that HESA (as a responsible provider of official data) has been bothered about for a while.
There is data out there that has a UK-wide value – information on parental employment among students for example, or state school backgrounds or historic free school meals status, previous work by HESA and UCAS has identified that data coverage is patchy and as a proxy for disadvantage is not always helpful.
In what HESA characterises as an “innovative and low cost” measure derived from Census 2011 data (so very easy to update when we get the Census 2020/1 data in) it has constructed a new measure that is comparable all over the UK. It’s an area measure – because these are fantastically useful in targeting work around local areas – but at an Output Area resolution, which takes you down to a few hundred people in around a hundred of households around a few streets.
What HESA ended up with is the proportion of residents in an OA who according to census data had their highest qualifications below level 4 and employment in National Statistics Socio-Economic Classification (NSSEC) groups 3-8 – the job groups likely to indicate lower socio-economic status. Those with long memories may recall UCAS used to collect NSSEC information from prospective students, this stopped in 2017 because of concerns over data quality. Using census data offers a neat small area solution to these problems.
The bottom 20 per cent (quintile 1, if you’d rather) of output areas in the UK by this measure are deemed to be the most disadvantaged localities. Given the smaller areas and refined measure this is a lot more nuanced than POLAR and IMD – you can see this in London especially (London tends to perform badly at IMD but well on POLAR when compared to similar parts of other cities).
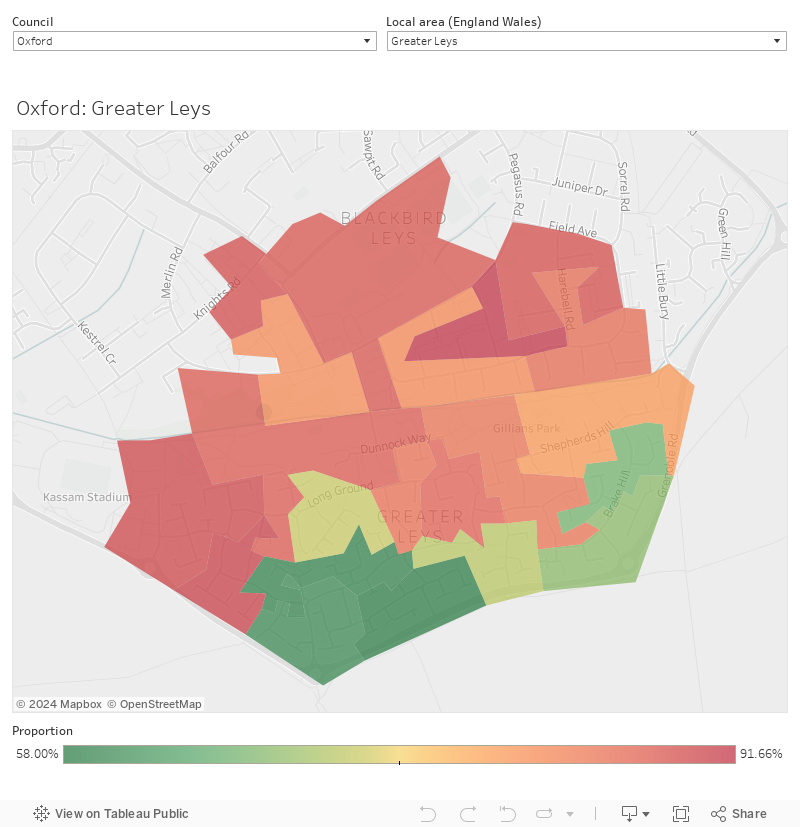
The data is available UK wide, but there are always issues with boundary data for Northern Ireland – I’ve plotted for England and Wales:
And Scotland:
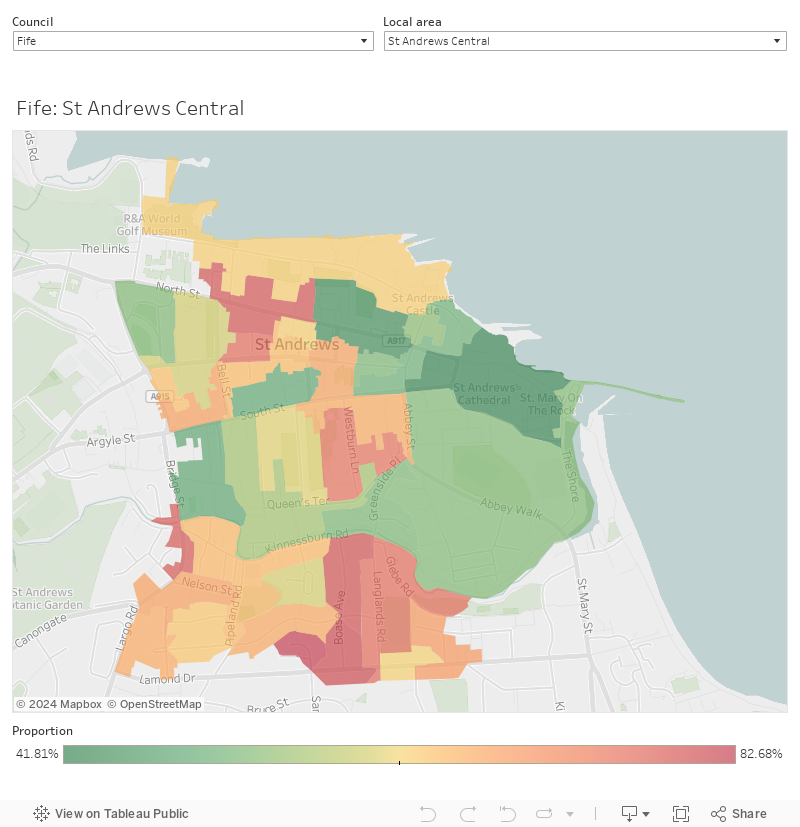
For each you can filter by local council (LTLA) and then local area (MSOA) – you need to select “all” local areas before you can switch to another council. Individual output areas don’t have names, but I’m hoping the map (with street names and details) will help you identify where these areas are. I’ve used the raw continuous indicator rather than just the quintiles, but if you are looking at areas coloured red it is fair to assume these are in the lowest 20 per cent locally.
Really useful David, thank you! Could you possibly add a region filter to the English map?
Excellent – is there a source for individual postcodes/way to search by postcode?
Hi Ellie – complex response to a simple question… postcodes are not an area based measure, and although postcodes are open data they are fiendishly difficult to work with as mapped areas. They also change every month. You can use the map search function to search for areas or even roads and then zoom in?
Thanks David – these are really interesting. As you say being able to work at OA scale is so much more useful than working with larger blocks, and the availability of 2020/21 Census data relatively soon is also a positive (any idea when this is likely?)
One moan – please don’t use green-red scales for your charts and diagrams. Put bluntly, it’s discriminatory, as around 4.5% of the population can’t read them properly (including me …) I’ve just about bored our local strategy and data unit into abandoning traffic light scales for risk registers and NSS analyses.