


The entire funding model in England and Wales is predicated – at least nominally – on how much it costs to educate a student.
The realisation that our understanding of how much it actually costs to do this is – at best – vague is a little disquieting.
Indeed from 2020-21 the old measure for this – the transparent approach to costing for publicly funded teaching (TRAC-T) – has been officially discontinued, leaving us flying largely blind in terms of what the government actual needs to put in to the system per student at a subject level at precisely the moment that fee freezes, inflation, and DfE-mandated shifts to direct funding are conspiring to make it harder for providers to do pretty much anything.
When providers make the argument for fee uplifts or subsidies, when students question what experience their fees pay for, or even when politicians rage about the profligacy of or lament the poverty of universities they do so on shockingly thin evidence.
TRAC record
New TRAC data released yesterday by the Office for Students suggests that sector spending on education home students exceeded income by £955m, up from £307m last year. To put that another way, universities and colleges recovered on average (median) 94.6 per cent of costs for publicly funded students – and although this varied by provider group (note that specialist providers recover just 80 per cent of costs) no group managed to break even on average.
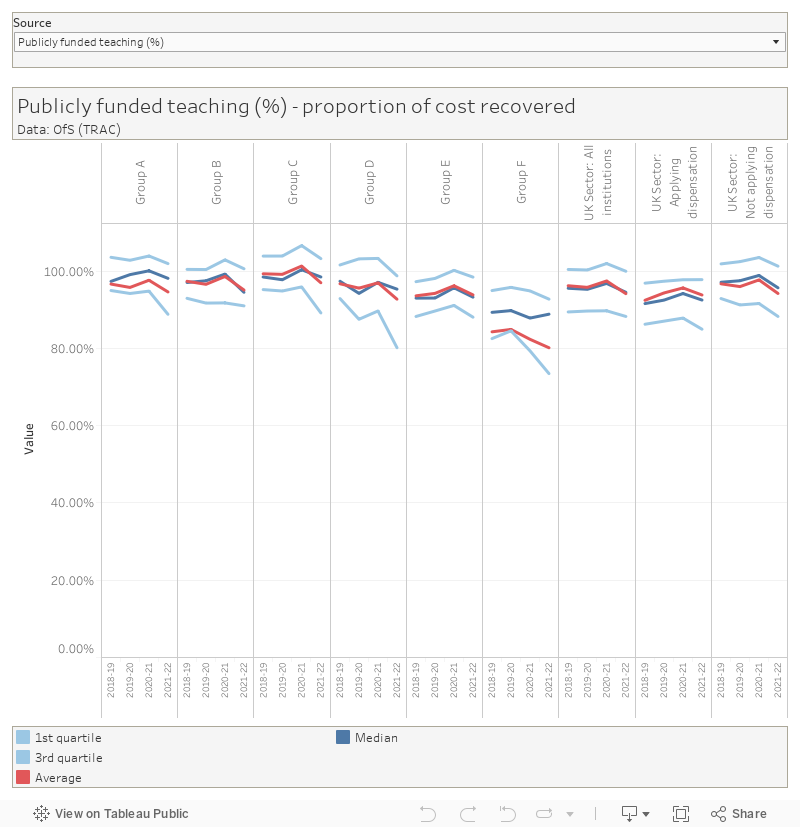
As you can see, it’s a drop over last year in most cases – and this with the oncoming rather than actual inflation peaks (and cost of living) concerns in mind. In university finance circles you hear a lot about the efficiency savings made at the back end of the last decade, and how Covid compounded these – for many providers we are cutting into bone at this point.
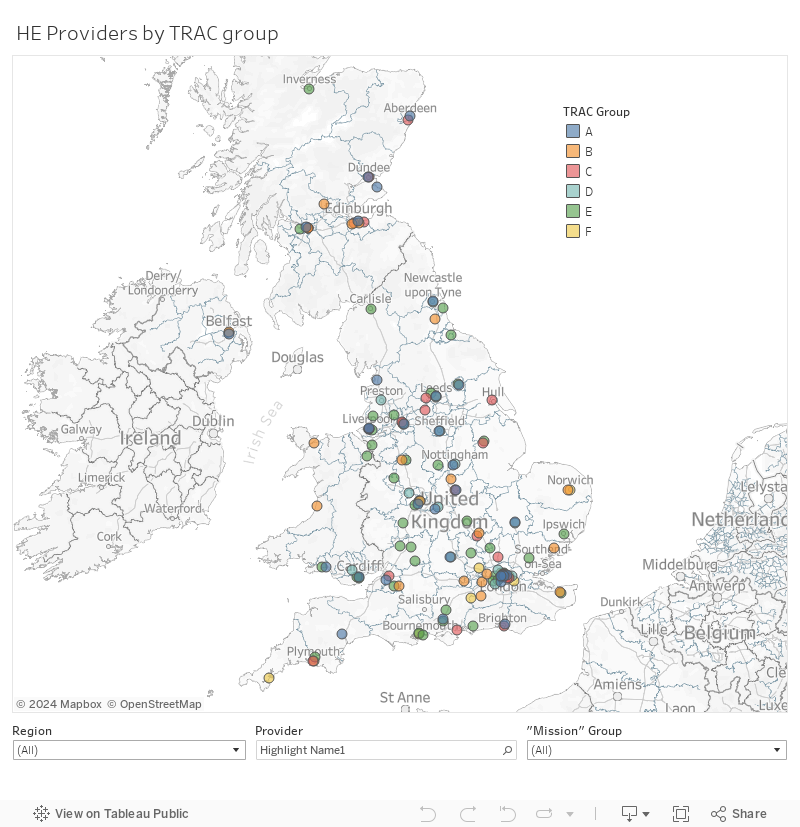
But we shouldn’t ignore the upper and lower quartiles either – some providers are able to make home students profitable, but especially in Groups D and F the bottom 25 are making serious losses. For convenience’s sake – here’s a guide to which groups you should be looking at and who they are.
Looking at research the picture is even worse – even the most research intensive group of providers didn’t manage to recover more than 80 per cent of their expenditure. We can break this down by income source, and only research funded by government departments saw any group of providers (in this case, group B – mainly non-Russell Group post-92 providers) make a profit as a median value.
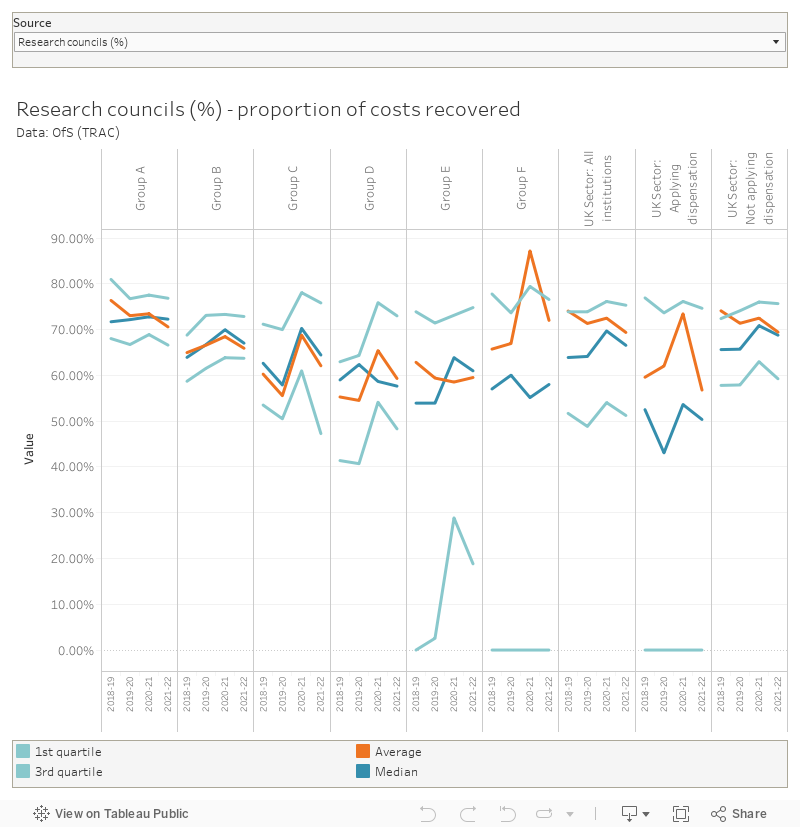
For a government that makes such great claims about research and development the fact that the majority of it makes a loss for universities must be faintly embarrassing. Likewise, the degree to which universities subsidise commercial research from other income is a huge national risk.
TRAC changes
There’s a handful of methodological changes to bear in mind this year. Guidance on the allocation of “other” costs between the various categories have been clarified, the costs of delivering apprenticeships are now included in teaching cost calculations, and there’s no longer a need for a board committee to approve TRAC submissions (just the TRAC oversight group and the accountable officer). You’ll recognise a lot of this from the recommendations made in the 2021 review of TRAC conducted by the OfS – and you should see the by year comparisons as indicative rather than precise.
Inside TRAC
Unless you are a specialist, you are most likely familiar with TRAC due to the collection of workload data. It is important to bear in mind that this calculation is an approximation only, and nobody sensible believes that it can generate anything other than an indicative, aggregate, average. To give just one topical example the time academics spend doing assessment and feedback work is seasonably variable – even though it may be a low proportion of your overall workload it does tend to take up large parts of April and May.
More widely, TRAC has always been an approximation of the costs of doing teaching and research as a university – with the majority of data coming from an institution’s own financial statements. Designed to inform funding allocations, TRAC calculations are most commonly seen in the calculation of the “full economic cost” of research. The fact that UK research grants do not, in general, cover the full economic cost of conducting research suggests it does not routinely do this to the satisfaction of funders or providers.
In teaching, TRAC is used to understand the differentials between teaching costs in (broadly) four subject area price groups. Again, the additional money that flows through the Office for Students doesn’t claim to address these reported costs, and the levels of additional funding for particular subjects are as likely to shift due to politics (or received opinions) rather than TRAC evidence.
One TRAC mind
Where TRAC turns up elsewhere it is abused as often as it is used – the uncontroversial “margin for sustainability and innovation” was used as a means to justify the ill-fated Augar recommendation for a £7,500 fee cap, though Augar in fact commissioned an alternate analysis of TRAC data to understand teaching costs. I guess universities don’t need to be sustainable or innovative -figures for 2021-22 show that the MSI floats (as usual, and as is standard government accounting practice) at around 10 per cent.
Our creaking funding model has not met the full economic costs of any part of university activity for a number of years – the “core” activities of teaching home undergraduates and conducting state funded research are loss-making activities that need to be subsidised by other work, most notably recruiting international students. There is a variability by subject and by provider, and there is a certain degree of suspicion that costs are massaged in some circumstances, but overall the status quo is not a situation that benefits anyone.
And I suspect that despite a likely increase in burden a better understanding of university operating costs needs to inform future funding. The question is whether this is something the sector does for itself, or something it has done to it by a government looking for savings rather than stability.


Of course, TRAC data is based on true and fair externally audited financial numbers so, even if there are estimates made within an institution as to what is spent on what, there are fixed points and the overall HEI bottom line is as correct as it could be. Without having time-allocation systems for academic staff to the TRAC categories, and with the need to allocate substantial overheads, could TRAC ever be more accurate? Or indeed any costing process?
The reality is that HE is a low margin business and, in some cases, no margin – which means that its activities cost about as much as the income received even prior to TRAC adjustments. Funds for re-investment are therefore quite limited.