


Higher Education Students Early Statistics (HESES) data is our first look at student numbers in providers in England.
With so much controversy about the most recent year of recruitment, especially among overseas students and at postgraduate level, it’s a chance to bust some myths, confirm some trends and get underneath the bonnet of a sector changing rapidly in size and scope.
Pop quiz
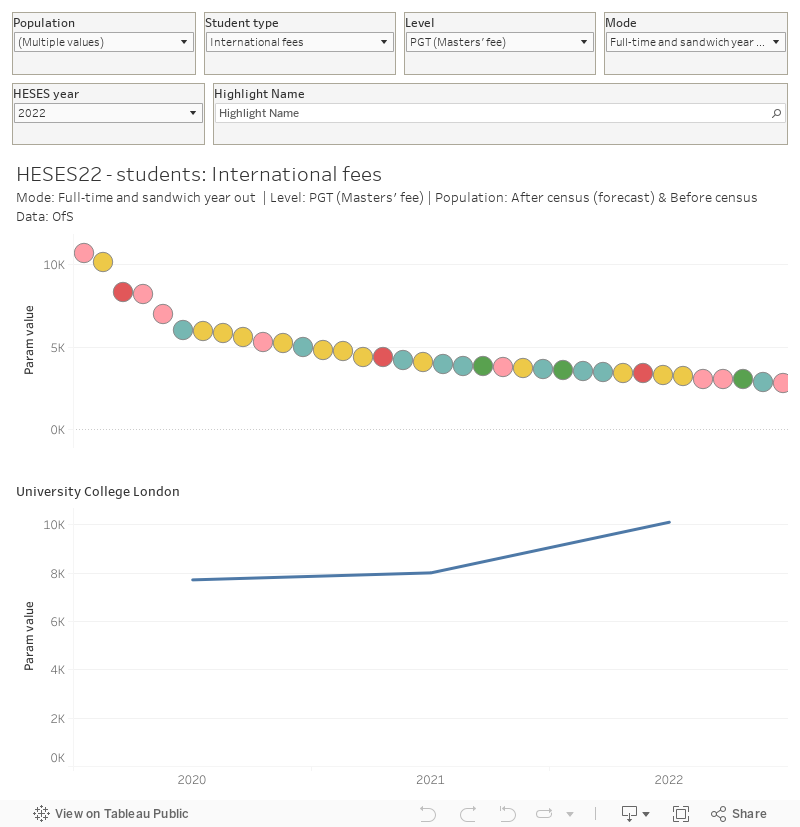
For instance – in the 2022-23 academic year which provider has the most fee-paying international full time taught postgraduate students?
Your guess may be a traditional, research intensive, provider. In fact, the 10,685 PGT FT international students currently at or expected to join the University of Hertfordshire make it the largest in the sector – just over 500 above University College London, and up from 5,090 just two years ago.
And which provider has the largest number of registered FT fundable home undergraduates (excluding those on sub-degree courses)? Guesses like Manchester Metropolitan University, Nottingham Trent University, or some of the larger Russell Group providers would be good – but the actual answer, with 29,165 such students, is Canterbury Christ Church University.
If these answers – or any figures in this data – strike you as unusual it is important to consider what is being shown and why. We’ve covered some of the more obvious points about the data collection later in this piece – but you also need to be aware that these figures refer to registered rather than taught students (so may – and in the case of Canterbury Christ Church very much do – include students registered at one provider but taught at another).
Many of the widely held concerns about the recent growth in student numbers (particularly students who do not pay home fees and students studying taught postgraduate courses) are based around the idea of place – for example whether students have enough space and enough resources to study effectively, or whether the impact on the local area (for example on demand for accommodation) has been considered.
HESES data doesn’t offer a lot on those concerns, but it does foreground concerns about other aspects of the student experience – can we be sure that students are receiving a high quality student experience if they are taught somewhere separate to where they are registered, can we be sure that wrap-around student support services have the required capacity, and so on.
OfS also points out that three years ago, students in HESES were split between “Home & EU” and “Overseas”, whereas in HESES22 they’re split between “Home fee” and “Overseas”. The change to eligibility for home fees applies to students starting courses from 1 August 2021, so HESES22 now has two annual entry cohorts of students that in earlier years would not have been classified as overseas, but now are. The impact of the change to eligibility is felt more rapidly on the population of postgraduate taught students, because they tend to be on courses of one or two years’ duration, whereas undergraduates are typically on courses of three or more years.
The charts
This representation of Table 5 allows for a ranking of providers by student numbers, given filter choices around type of student (domicile, fee status, level of study, mode of study, year). Mousing over a mark on the ranking (use the highlighter to find your provider of interest) shows the way numbers of these students have changed over three years – though note that undergraduate students are returned in a new way for 2022-23 HESES.
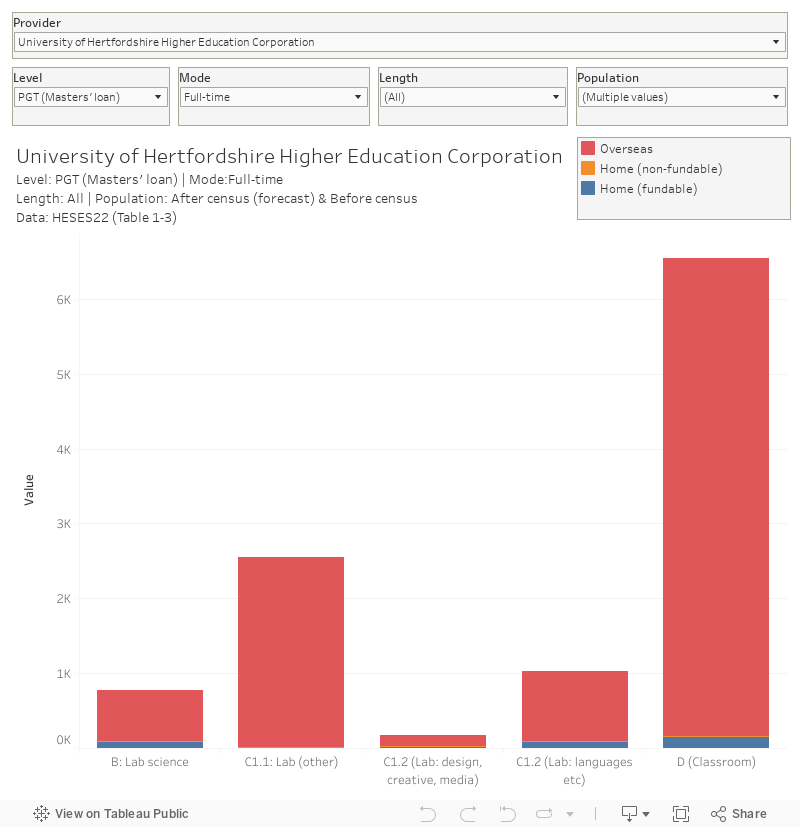
And here DK has plotted the most recent year of tables 1, 2, and 3 as a way of allowing you to view the state of an individual provider according the HESES – with filters for level, mode, length (standard is less than 45 weeks of full time provision or the equivalent, long is the equivalent of full time study for more than 45 weeks not including work placements), and population (any mix of pre- and post- census date, plus projected-completions and projected non-completions). Use the top filter to find your provider – note that some names may be slightly different than usual as we have used the OfS-supplied names.
What’s a HESES and why isn’t it a HESA?
The Office for Students uses HESES data primarily to determine the amount of funding allocated to providers with respect to areas of provision that attract a premium – these include the subjects in higher cost price groups, and other areas of interest to the regulator. It’s also used as the source of student number data used to inform the allocation of other funding at a provider level.
This all made a little more sense when the OfS’ predecessor, HEFCE used to allocate funding based on all (fundable) student numbers. The amount of money handed out by OfS is smaller (but not insignificant), yet the majority of the burden (for Approved (Fee Cap) registered providers at least) remains.
Unlike the whizzy HESA data collection tools and technologies, HESES is resolutely old school in feel. Providers submit an honest-to-god Excel workbook – and the deadline for providers (12 December) is scorched into the soul of every student records officer. The other key date is the census date (1 December) – as you explore the data you will see that data related to students joining the provider after that date is supplied as a forecast.
The other main difference from the HESA data you may be used to is timeliness – this release refers to student activity during the current (2022-23) academic year. For this reason, even though the aim and layout of the collection is squarely focused on academic convenience, those who persevere (or those who read Wonkhe) can get the headlines from the 2024 HESA Spring student data release nearly a year early.
Key concepts
We’ve simplified some of the arcana in this release (if you are keen, get stuck into the OfS guidance) in presenting these dashboards, but there are a few other key concepts to understand.
Firstly – a “fundable” student is one that is eligible for a home fee loan and can attract funding from OfS to the provider in question. This obviously excludes most international (it is possible, for example as a refugee, to be fundable while not being resident in the UK) and postgraduate students, but also excludes students funded by the NHS or the Department of Health (medical, nursing…), students on initial teacher training courses or other teacher training related courses (funded by a different bit of DfE), and students on closed (employer specific) courses or courses where they hold an equivalent or lower qualification.
The second oddity is what we’ve called “population” and OfS calls “columns”. Broadly speaking, if the course you are on has a component that takes place before the (1 December) census date you are recorded in column one, whereas if it doesn’t have a component that takes place before the census date but does have a component that takes place between the census date and the end of the academic year, you are returned in column 2. Column 2 is referred to as a forecast.
There’s also a “new entrants” column, that specifically records those in column 1 where this is their first instance of higher education on the course of study they are taking.
The final unusual columns can be seen in the visualisation for tables 1,2,and 3 – featuring both projected non-completion (the number of students, currently enrolled, that a provider would expect not to complete the year of their course) and completion (the number of students expected to complete the year). The definitions are subtly different to those you may be familiar with from B3 or HESA data – referring here to the completion of a final assessment linked to that instance of study, and the expressed intention of a given student.
Other than that, you need to remember that distance learning (of whatever intensity) is always part-time for HESES, and that it is perfectly possible to pay an undergraduate fee to study a postgraduate year (the last year, for example, of an integrated masters).
Regulatory rapidity
Nationally, on raw numbers the change to the student population has been extraordinary. HESES 19/20 had international students at 332,150 – that’s now 546,845, or a 65 per cent increase in just three years, and over 100,000 of that increase has been in the past year alone.
If you assume that home students have been fairly static, and that in many cases they’re now just moderately more concentrated in some providers, the idea that England’s university cities had 214,695 bed spaces for international students lying around empty four years ago (or that anything close to that number have been added via new build) is pretty fanciful.
And the idea either that local areas or even universities themselves have properly planned for the social changes or infrastructure needs of some of the more dramatic city by city stories here is also not credible. Even if you believe the invisible hand of the market can take care of much of that, it almost certainly can’t this quickly.
At provider level, a click around the charts for half an hour or so suggests that providers are handling the financial storm presented by the undergraduate unit of resource being frozen in four different ways:
- The first is a group of providers that have seen (often very) sharp increases in their international PGT populations while their population of home undergraduates has declined;
- The second is a (smaller) group of providers whose home student undergraduate numbers have rapidly increased – intel suggests this is principally through franchising;
- The third is a group of providers – often in the more selective end of the sector – that rapidly expanded their home undergraduates over the Covid years, and are now maintaining that size while increasing their international PGT numbers;
- And then there’s a group of providers whose numbers are just in decline in general – where wider intel suggests either very active and careful portfolio management and module demand smoothing, or a lurch from redundancy programme to redundancy programme.
What that all raises for the regulatory part of OfS (rather than the data bits) is some really serious questions about its approach to monitoring quality.
Three in ten
Ignore the international aspect for moment, and consider that the English sector (on raw numbers, not FTEs) is now almost 30 per cent postgraduate – and then recall that a postgraduate NSS is (still) conspicuous by its absence, and that postgraduates are missing from the TEF. Even on outcomes (rather than satisfaction or above baselines excellence), B3 doesn’t look at international graduate employment.
Then consider the rapidity of some of the changes. At steady state there’s nothing to suggest that any providers’ individual mix of students is inherently harder or easier to teach and support than any other.
But there is a lot of evidence to suggest that sudden and rapid changes to the make-up of a student body is hard to handle – and it’s not unreasonable to at least raise questions about the way in which some providers have coped with in some cases doubling or tripling their franchised or international PGT populations in a very short period of time.
If the sector’s line is that rapid expansion is all perfectly possible and straightforward to handle, if nothing else it will be hard to argue that rapid contraction is somehow impossible if the government was to introduce curbs on international recruitment or even home domiciled numbers.
The fear is that parts of the English sector, trading on reputation and desperate to make the budgets add up, may have flooded the “market” with international PGT and franchised UG places so rapidly that the experience on offer doesn’t match the minimum described by the regulator’s B conditions or the sector’s reputation. Worse, OfS would likely struggle to argue that its arrangements for knowing whether this fear is founded are really up to scratch.


“Providers submit an honest-to-god Excel workbook – and the deadline for providers (1 December) is scorched into the soul of every student records officer”. That’s not even the correct deadline ! That’s the census date..
Hi, looking at your tableau dashboards and comparing them to the published data set (https://www.officeforstudents.org.uk/data-and-analysis/data-collection/get-the-heses-data/), you appear to have excluded the large number of FE colleges that complete HESES. Is there a particular reason for that?
Why has Wonkhe started using nightmarish AI generated stock images? The reason that old man looks so concerned is not because of student numbers but the fact his colleague has 8 fingers on her right hand.
Also, I’m pretty sure the man is an alternate dimension Ridley Scott!!!
It is a little known fact that university accountants have evolved eight fingers on each hand to help them with counting the rapidly increasing student numbers
David are you planning to submit anything to the OfS parliamentary committee inquiry?