


There’s three steps to the UCAS Cycle – an application, an offer, and the acceptance of that offer.
In the most part, UCAS mediates every part of this dance between the eager prospective student and the accommodating provider of their dreams. But to see the process as a series of transactions is an unwelcome simplification – strategy plays a part on each side. Here I’m going to take a look at the raw numbers of applications, offers, and acceptances for UK domiciled entrants in order to foreground the ways that provider-side stratagems interact with demand.
Playing the game
So here’s three data points and two synthetic measures, with caveats
- Applications: these represent every application received by UCAS before the (final) June deadline. Data is also available for applicants – this a slightly smaller figure as it is entirely possible for a prospective student to apply to two different courses at the same provider. You could see the number of applications as a proxy for the attractiveness of an institution or course.
- Offers: The provider will then make a decision as to whether to offer a prospective student a place. As we’ve covered on Wonkhe previously unconditional offers are playing a greater part in this process than in previous years, but in the most part offers are conditional on the achievement of level 3 qualifications.
- Acceptances: Prospective students will then decide, from all the offers they receive, on a firm and insurance offer. Assuming they meet the conditions places on their offer, a prospective student will be accepted onto one of these courses at one of these providers.
- Offer rate: the percentage of applications that result in offers being made. This can be seen as a partial proxy for the selectivity of an institution – making offers is a strategic choice based on numerous considerations, which can be boiled down to the tension between ensuring that both the right number and the right kind of students are recruited. It’s tempting to see institutions with a high offer rate as being desperate to fill places, but it could also be that the information they provide to applicants has resulted in a pool of applicants that are well suited to that course or institution
- Acceptance rate: the percentage of applications that result in an acceptance. This is our only UCAS window into student decision making – though in reality the acceptance rate depends both on the decisions of prospective students (linked again to institutional or course attractiveness), and the academic performance of the prospective students (whether or not they get their grades.
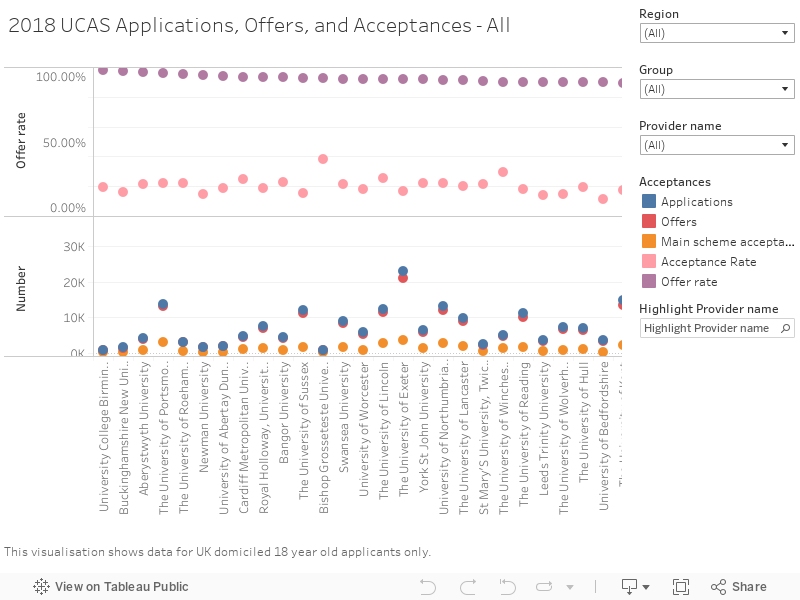
This visualisation shows offer rate and acceptance rate at the top – sorted by offer rate. Raw application, offer, and acceptance numbers are at the bottom. Clicking on a data point will show data for that institution in a more readable form, and you can mouse over to see the figures. I’ve offered the usual filters to allow you to examine data by provider group and provider region. – you can also manually choose to look at a particular provider, or highlight a provider on the main graph. I’ve used data for 18 year old entrants so as to be consistent across both visualisations.
Deeper into offer rates
The offer rate statistic I calculated above is just a straight percentage, but UCAS has also developed a more sophisticated measure that takes into account demographic expectations. By doing this, we are able to look at the difference between an expected offer rate and an actual offer rate for different demographic groups – POLAR4, SIMD (for Scotland), Ethnicity, and Sex – for 18 year old entrants.
There are a complex set of considerations as to understanding the significance of these differences – UCAS have provided a lookup table to allow us to see whether a difference for a particular group at a particular provider is something we should be concerned about, or just background statistical noise.
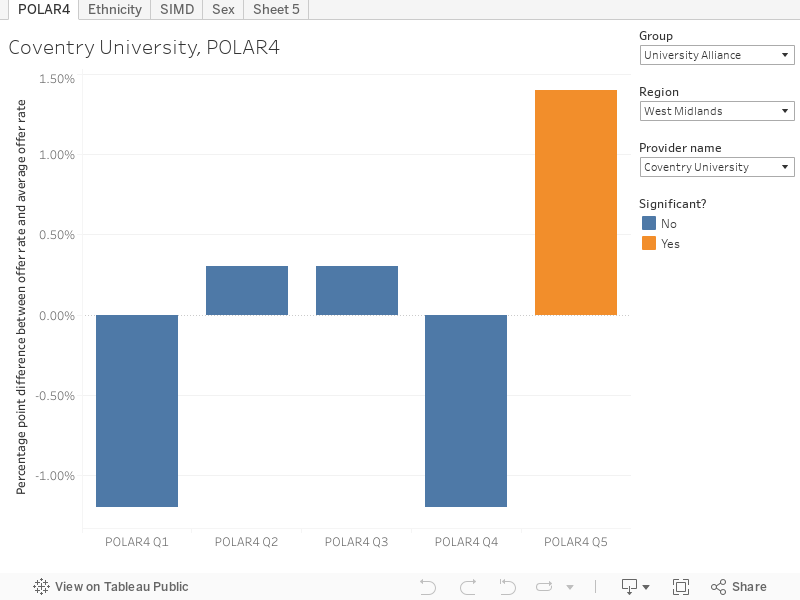
This visualisation used colour to indicate whether a difference is significant based on the UCAS table. You can use the tabs to choose whether to examine POLAR4, Ethnicity, SIMD, or Sex. Choose an institution of interest via the drop downs on the right. You’re looking at data from 2018 – although a time series is available for those who are keen to examine these trends further.
A rare glimpse
It’s not been made easy to look at the significance of differences in offer rate for different demographic group. The look-up table is published only as a PDF, meaning that this information is very difficult to combine with the offer rate data at scale. I’m not sure why this is the case – it’s not trivial but far from impossible to match each institution and group based on the average offer rate. You can do it using the SUMIFS function in Excel if you are so minded. I recall working with David Morris to do this last year – and to save other wonks this hassle the data for 2018 is available to download from Tableau.
Not including a measure of significance alongside data is far from good practice – I’d hope that in future years UCAS makes this data available to everyone. It is time for the sector to explain evidence of significant bias in offer-making – clear presentation of the available data is essential in order for this to happen.


While this dataset has its issues, it remains preferable to the raw approach that the Transparency Condition will take. It at least tries to account in a limited way for candidates’ qualifications, and UCAS acknowledge most of the limitations in the small print. However, it could certainly use some enhancement of how it does this. I’ve spent a lot of time unpicking the method with the help of people at UCAS and while it’s the best we have, it’s a long way from perfect.
For instance, its treatment of candidates with non A level qualifications is extremely blunt and could actually have the unintended consequence of discouraging rather than encouraging their use by institutions, were this dataset ever to achieve greater prominence.
It also gives no ‘credit’ for making lower offers based on contextual data or any other factor, as it only counts whether an offer is made; not what it is.
There are other potential unintended consequences of a simple focus on offer rates. It could conceivably deter institutions’ outreach staff from encouraging marginal candidates to make an ambitious application to a highly selective programme, where they have a finite but low chance of getting an offer. On the other hand, it would be easy to game an institutional score by making conditional offers to people you know have no chance of achieving them – with the likelihood that come August they’ll be thrown back on their Insurance choice or Clearing, with the known impact that has on their retention prospects.
Are you sure that the data in the first table is correct? LSE receives a lot more than 5k applications a year, and Cambridge a lot more than 9k. I doubt that LSE would be able to fill in its circa 1.7k intake with 1.8k offers.
That’s the data as published by UCAS. It may be because this field relates to UK domiciled 18 year olds.
Then the data is woefully incomplete. You could at least make this clear in the title.
@hEYLo – it’s clear in the text. I’m not sure “Man looks at applications, offers, and, acceptances for UK domicile” is much of a headline.
How is it clear in the text? The only mention of ‘UK-domiciled’ is in the comments section. And that’s only because I brought it up. I actually wouldn’t have a problem with that title – it doesn’t seem to be too different from some of the others you see periodically on wonkhe.
(Unless you’re expecting the casual reader to infer from the fact that POLAR analysis is possible that the data is UK-only. That would be a reasonable assumption; just one that not everyone will make).
Last sentence of the opening paragraph…