


I’ve got a theory about KEF – if it didn’t have such a flashy name it wouldn’t get half the attention it does.
The Knowledge Exchange Framework is not (like REF and TEF are) an “excellence framework”. It doesn’t make any judgement on the quality of business and community interaction, just on the proportional volume and likely output of a number of activities described in the HE-BCI survey data. Neither is it of use to professional or armchair rankers – it doesn’t offer named awards or simple stepped gradations that demonstrate one thing is unfailingly better than another.
It may eventually be used to support the allocation of the £200m Higher Education Innovation Fund (HEIF), which is currently allocated using similar data. But for the first year (2020-21) it is for entertainment and edification purposes only.
Note: the data presented here is under review, and has been updated several times with the support of many specialists in the sector. Please read the caveats carefully.
KEF under the bonnet
Though we’ll have the results of the first iteration of KEF in the summer, much of the data that underpins them has not yet been published. We’re expecting the next iteration of HE-BCI data from HESA in April – meaning currently we have only two of the three years of necessary data. What’s more, a small amount of data in the form of self-assessments and narrative statements still needs to be collected, and there is a co-authorship of research outputs strand where a suitable source needs to be identified.
Two or more metrics sit under seven perspectives as follows:
| Perspective | Metrics | Historic data available currently? | |
|---|---|---|---|
| Research partnerships (RP) | Contribution to collaborative research (cash) as proportion of public funding | Yes | |
| Co-authorship with non-academic partners as a proportion of total outputs (data provider TBD) | No | ||
| Working with business (WB) | Innovate UK income (KTP and grant) as proportion of research income | No (Innovate UK data not available) | |
| HE-BCI Contract research income with non-SME business normalised for institution size by HEI Income | Yes | ||
| HE-BCI Contract research income with SME business normalised for institution size by HEI Income | Yes | ||
| HE-BCI Consultancy and facilities & equipment income with non-SME business normalised for institution size by HEI Income | Yes | ||
| HE-BCI Contract research income with the public and third sector normalised for institution size by HEI Income | Yes | ||
| Working with the public and third sector (WPT) | HE-BCI Contract research income with the public and third sector normalised for institution size by HEI Income | Yes | |
| HE-BCI Consultancy and facilities & equipment income with the public and third sector normalised for institution size by HEI Income | Yes | ||
| Skills, enterprise and entrepreneurship (SEE) | HE-BCI CPD/CE income normalised for institution size by HEI Income | Yes | |
| HE-BCI CPD/CE learner days delivered normalised for institution size by HEI Income | Yes | ||
| HE-BCI Graduate start-ups rate by student FTE | Yes | ||
| Local growth and regeneration (LGR) | Regeneration and development income from all sources normalised for institution size by Income | Yes | |
| Additional narrative/contextual information | No | ||
| IP and Commercialisation (IPC) | Estimated current turnover of all active firms per active spin-out | Yes | |
| Average external investment per formal spin-out | Yes | ||
| Licensing and other IP income as proportion of research income | Yes | ||
| Public and community engagement (PCE) | Provisional score based on self-assessment developed with NCCPE. Optional submission to Research England as part of narrative template to be provided in February 2020. | No | |
| Additional narrative/contextual information | No |
The major change from the consultation is the use of a subset of institutional income (funding councils, tuition fees, research contracts) as a way to control for institutional size in place of staff numbers. Income from facilities and equipment are now also included when considering working with business. And a measure of academic time commitment to public and community engagement has been replaced with a provisional self-assessment score based on an instrument co-developed with the National Co-ordinating Centre for Public Engagement (NCCPE).
Metrics are a three-year average, mostly (as can be seen from the table) as ratios, which are converted at perspective level into deciles. This reduces a great deal of data and analysis into what amounts to a set of marks out of 10, which are compared to an average mark from comparable institutions (the infamous clusters) – externalising the strategy office job of identifying sensible comparators via a superbly rigorous report. The composition of these clusters is mostly as in the consultation, there are a few changes to some of the smaller groups that will be made in consultation with the institutions in questions
But what will it look like?
Research England has a grand plan to use spider graphs to show institutional scores alongside cluster averages, with an option to drill down into more detailed data on each metric. I’m not as struck by this as they are – the exercise is designed to support comparisons and spider diagrams are an unwieldy way to do this. I also feel like the individual metrics are still fairly abstract, you have to go quite a long way back down the methodology to get something that the mind can easily take hold of.
But I wanted to give you some sense of what the results would feel like, so – using the last three years of available data – I’ve plotted the top level metrics as two simple bar charts, one each for a provider and their appropriate clusters (using the originally consulted-on groupings). Because I was interested enough to run this imaginary exercise UK wide, there are extra groupings for Wales, Scotland, Northern Ireland, and I’ve also included a number of English HEIs that would not be required to enter the KEF. These additions do have an impact on the (ranking-derived) scores for core English HEIs. Think of this as an expanded KEF year zero, if you will.
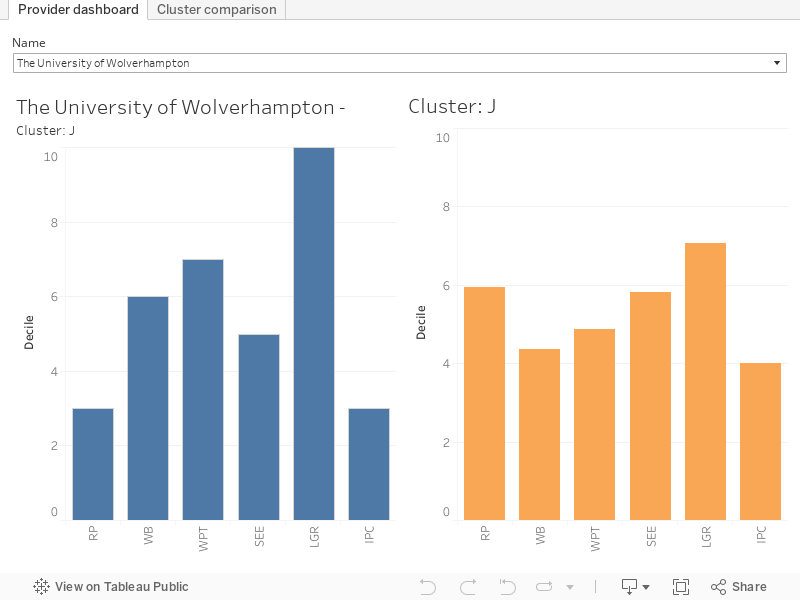
On the main dashboard you select the appropriate comparison cluster by moving your mouse pointer over any of the institutional bars. I’m not convinced that, on average, there is a massive difference in terms of these metrics between the clusters, something you can see a little more clearly via the “cluster comparison” tab.
Update: This presentation has changed several times following feedback and suggestions from the sector. It’s never going to be perfect, but it will become more useful (and more accurate, within the bounds set by the expanded way I’ve run the exercise) as time passes.
Closing thoughts
I’ve hung around a lot of league table compilers to know about the sniff test – a ranking needs to look right (with the right kinds of provider at each end) as well as have a defensible methodology. However we try to deal with our prejudices, all of us carry around an idea of which providers we would expect to find where in any given instrument – which is what makes this first glimpse of KEF all the more fascinating. Though this isn’t a new set of data or a new area of analysis, Research England has succeeded in developing a refreshing and challenging new tool to make sense of what happens in the sector. I’m fascinated to see it run for real in the summer.
Caveat: Though (as with all these things) I’ve run KEF year 0 to the best of my ability, it is entirely possible that I may have got something wrong. If I have the error is mine – so please complain to me and not Research England. I’ll continue to endeavour to fix issues that people spot – and I’m always happy to chat about KEF!


Looking at the clusters tab, you could conceive a ranking from the sum of decile scores. But, because the analysis is cluster based, it’s impossible to compare between clusters. So that may be step to confound the compilers. (Unless they just get the raw data, nearly all of which is open data, and use that…)
Thank you for this – good to get a sense of what the results might look like.
Is the InnovateUK dataset the one available here? https://www.gov.uk/government/publications/innovate-uk-funded-projects
As the comparison is based on deciles, surely all the cluster averages will tend to 5 – so is cluster comparison on this basis valid?
Anne M – the method described by RE is that the decile position is across the whole sector, so when put into clusters you can get a mean average for the cluster that is not 5. (This didn’t have any clarity in the initial consultation on KEF, but the published method is quite explicit).
Thanks!
Hi David, thanks for this – very interesting. Are the tableau charts based on the final metrics, including the HEI income normalisation, or the previously consulted ones?
C
Great stuff. What data are the public and community engagement scores derived from? the KEF identifes self assessment as the methodology which hasnt been undertaken yet?
Apologies – I now note there isnt a score for this yet