


There has been much chatter in recent years about the financial health of our institutions. But what’s really going on?
Last year was the first time HESA made their complete finance data set openly available under the Creative Commons 4.0 Licence – a release that also included their Key Financial Indicators (KFIs).
These KFIs are a set of ratios based on each institution’s submitted finance data. Such a comprehensive release from HESA led to a flurry of analysis and comment, most notably David Kernohan’s KFI is going to rock you and VisualisingHE’s Frolicking with finance.
As David’s article hints, the finance data is also used to construct a “Security Index” which is a perk for HESA’s HEIDI Plus subscribers (now being delivered through their partnership with Jisc). The Security Index uses a subset of the KFI ratios to evaluate the relative financial security of institutions.
Evaluating security
That HESA release happened at the time I was submitting my doctoral thesis, which among other things contained a challenge to how the financial security of higher education institutions are currently evaluated. My research examined income diversification in higher education as a strategy to reduce exposure to the vagaries of market forces and government policy. The study analysed five years of full HESA datasets and constructed a National Income Diversification Index.
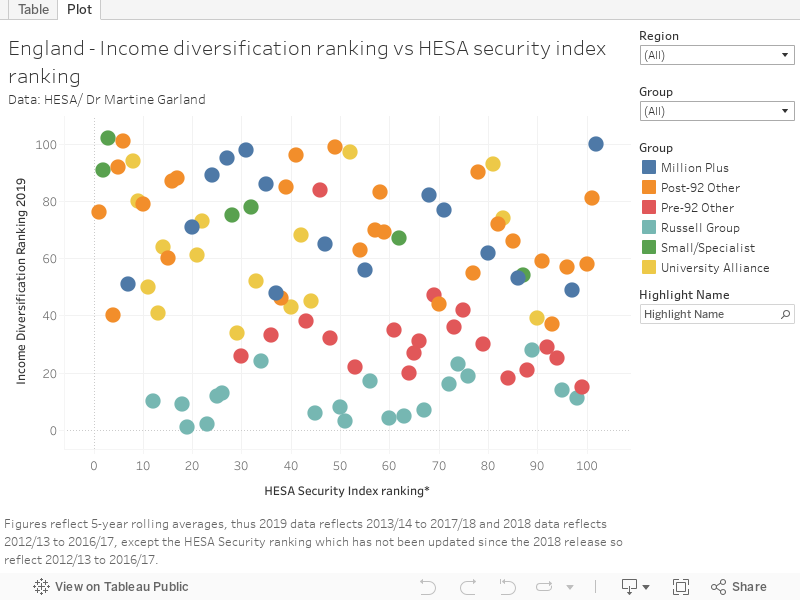
The findings were in some ways unsurprising – for example, it is the Russell Group and pre ’92 universities that are the most financially diversified and thus can be viewed as less vulnerable than their post ’92 counterparts.
But an interesting finding was that the Income Diversification Index results were in direct conflict with the HESA Financial Security Index mentioned above. With only a couple of exceptions, the top 20 places on HESA’s index are occupied by post ’92 institutions. This is an inverse of the Income Diversification Index, where the top 20 places are held by pre ’92 institutions.
For example – according to the Security Index, Birmingham City University is in the top 10 for financial security, yet they place in the bottom 10 of the Income Diversification Index. King’s College is in the top three most financially diversified universities and yet are at 51st place in the Security Index. So what’s going on? During the qualitative phase of my research, I was able to explore this apparent contradiction and establish why it matters.
When you look at it like this…
Modern Portfolio Theory, Resource Dependence Theory (and common sense) suggests it is not wise to be overly dependent on any one source of income. Higher education institutions receive income from multiple sources, formally reported under five categories; tuition fees and education contracts, funding body grants, research grants and contracts, other income, investments and donations. A strategy of income diversification therefore seeks to reduce dependence on any one source, and has been used in various higher education contexts as a measure of financial health.
If you consider our competitive market for students, Birmingham City University being dependent on tuition fees for 77 per cent of its income may create a problem if something were to happen to their market share, or if there is a cut in tuition fees. Whereas for King’s College, tuition fees account for just 33 per cent of their income portfolio – much less exposed.
Of course income related to research, income from donations and public funding are all competitive processes in one way or another, but if you are not overly dependent on any particular one, the risks are reduced. There is an important caveat to this strategy however – the income needs to have “margin”, it cannot be “income at any cost”! For more on income diversification in the non-profit sector, Hung & Hager (2019) is a good start.
Under the bonnet
In my qualitative phase. I was fortunate enough to be able to interview pro vice chancellors and directors of finance across a wide range of universities including the Russell Group. The interviews confirmed that although not without their financial challenges, universities with a diversified income portfolio perceive themselves to be less exposed to the impact of market forces and government policy, and consequently feel less financially vulnerable.
So why the contradiction in the indices? The prevailing view was that the HESA Security Index focused on borrowing and surpluses, so the pre ‘92s with their higher research overheads, lower surpluses, lower liquidity and the confidence to take advantage of borrowing would not fare as well on these types of measures – but are nonetheless financially secure!
Some interviewees even pointed out that their diverse income sources were cited as a positive by the Moody’s rating process. It was also suggested that post ‘92s, feeling in a more vulnerable position, were more likely to retain their surpluses and be reluctant to (or unable to) borrow, which improved their Security Index score.
Whether or not you can see the Security Index on Heidi Plus, one can see from the Key Financial Indicators (thanks to David Kernohan’s interactive presentation of them) that the pre ’92 universities do not fare as well. Sean Wellington made a similar observation in his 2007 paper The financial security of UK HE institutions, where inclusion of his broader measures inverted the Security Index results (at that time the focus was over-dependence on public funding).
What this tells us is that a broader range of indicators are needed to reflect a truer picture of the financial health of our institutions. So we could add the level of income diversification to HESAs Key Financial Indicators (and thus the Security Index). But are we sure we’re measuring income diversification in a meaningful way?
Building an income diversification index
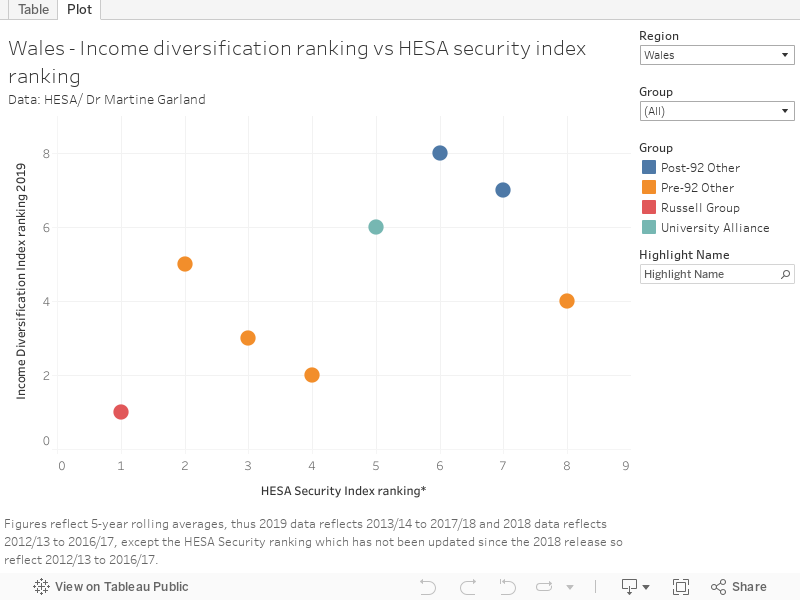
The index focuses on the publicly-funded, more generalist universities i.e. not music conservatoires, veterinary colleges, postgraduate only etc. The index is built from averages of five years of data initially to 2016-17 (as that was the most current dataset available at the time of the main study), the original research only looked at institutions in England. The Index presented here has since been updated with the latest HESA 2019 release covering 2017-18, and will be updated again with the 2020 release in the spring that covers 2018-19 (thus the Income Diversification Index is based on a rolling 5-year average). Given my recent move from Gloucestershire to Aberystwyth University, the index now also includes Welsh universities which creates an interesting picture. Again it is the pre-92s that dominate, but they are ranking well against their English counterparts.
5-year averages are used mainly because in any one year there may be an exceptional event that would skew the data e.g. receiving a substantial donation or winning a major research contract. It also took time for all student cohorts to be on the higher £9,000 fee level. Needing five years’ worth of data means a few universities are precluded as they have not been in operation, or reporting to HESA in their own right for five consecutive years.
Here comes the clever part – as mentioned above, university income is reported under five categories, but if you want to get a true picture of financial diversification, one has to consider what of that income relates to third-stream activity. Working with HESA definitions for both the Finance Report and the Higher Education Business and Community Interaction (HE-BCI) survey and numerous conversations with their data team, my analysis disaggregated third-stream income from “core” income to create six income categories i.e. added “third-stream” to the five categories above.
Now we have our income categories, we get to the maths bit; the Hirschman-Herfindahl Index (HHI) is widely recognised as a measure of income diversification in non-profit research. The index measures concentration and therefore its inverse diversification. If all income is derived from just one source, then the index score would equal 1. As the number of sources of income increases, the index score moves towards 0. The index score also heads closer to 0 the more equally the income is distributed across the income sources.
In England and Wales, all publicly-funded universities have access to the same number of income sources noted above, so the index score is primarily affected by how balanced the proportions of income derived from each source are (reducing dependence on any one source). A higher HHI score reflects a less diverse income portfolio; a university with an HHI score of 0.23 is more diversified in terms of their income than a university with a score of 0.76.
Data for England
Data for Wales
Clearly as institutions of education and research, universities will never have a perfect balance across all sources i.e. there will always be a higher percentage in teaching and research related activities. For the mathematicians among you, the Hirschman-Herfindahl Index is defined as the sum of squares of the percentage share of each income stream out of total income.
Given the public nature of the functions of universities, it’s important for all sorts of reasons to know about their financial health. Students, the public and funders all invest in universities as much as they do in the specific “outcomes” they are specifically interested in. Above all what my research demonstrates is that highly simplistic measures may mislead – and that given the sophisticated way in which their finances work, we need agencies and regulators to develop more sophisticated ways in which to assess their financial health.


The issue of income diversification is relevant to financial sustainability only when the revenue generating activities are profitable. Universities are charities and undertake many diverse activities with no net gain as part of their contribution to public benefit. Some of these activities may even be loss making so the assumption that measures of increased income diversification leads to increased security seems tenuous.
Diversification is not just about being overly reliant on tuition fees. An institution will a significant proportion of its funds coming from tuition fees can be diversified if the source of those fees has a rich mix of different areas of activity. That way, if a particular area becomes less important to the Government of the day, another may take it’s place.