


Last Friday saw the annual release of data from the Students Loan Company (SLC), allowing us a detailed look at student number trends and associated income.
We got figures for the English, Welsh, and Northern Irish systems – though only the English release included data on a provider level. If you are wondering about Scotland, these figures were published last month.
What these tell us is the number of individual students that were eligible for and took out both tuition fee and maintenance loans from each sub-UK HE funding system. The existence of historical data helps us see the way the size and shape of the sector is changing, but we also need to take account of policy changes (for instance, the removal of all remaining student grants in England) that take a while to filter through the system.
By nation
In Wales, 53,900 students were in receipt of tuition fee loans, with 57,400 taking out maintenance loans. Of fee loan students, 34,400 were at Welsh institutions, 22,200 at English institutions, and 400 were studying elsewhere – proportionally the slow trend towards studying in Wales continues.
Meanwhile, in Northern Ireland the trend runs in the other direction: 27,400 NI-domiciled students were studying at providers in Northern Ireland, with 13,200 studying elsewhere in the UK . The former is the lowest since 2012-13, the latter the highest on record.
A record 482 institutions enrolled students eligible for English tuition fee loans in 2017-18, of which 361 taught students eligible for maintenance loans. For those students studying elsewhere in the UK, Wales was the destination of choice. A little under 30,000 England-domiciled students were studying in Wales, compared with a little under 14,000 in Scotland and just under 700 in Northern Ireland.
In Scotland, a little over 175,000 students – both full-time and part-time – were supported by maintenance loans averaging £5,470 per student in 2017-18. There has been a marginal increase in loans and grants awarded with the number of full-time students receiving support increasing by 3.1% from 143,500 in 2016-17 to 147,920 in the last academic year ending 2018.
The English system
The UK HE sector’s income from the Student Loans Company (SLC) comes from three main avenues: loans to cover tuition fees, loans to cover maintenance costs and grants. The release concerning income relating to the English system allows us to look at individual institutions and their English domiciled students. There’s also some data on EU students studying in England.
Income from tuition has seen the steepest increase in the six years to 2017. Since the 2012 rise in tuition fees this has been the dominant source of sector income from SLC. However, the growth rate of sector income from tuition fees has slowed over the last few years, alongside an increase in income from maintenance loans. In 2017, the HE sector received almost £9bn in loans to cover tuition fees.
Looking at English-domiciled students studying elsewhere in the UK, Wales was the destination – a little under 30,000 English students are studying in Wales, compared with a little under 14,000 in Scotland and just under 700 in Northern Ireland.
The size of maintenance loans paid to students, at around £5.6bn in 2017, has risen steadily while grant income has fallen since the removal of maintenance grants in 2015. Grant income has seen the least change over the size year period: SLC paid out just under £1bn in grants in 2017, down from approximately £1.6bn in 2011.
The trends in income across the three areas – loans for tuition, loans for maintenance and grants – were broadly similar across the East, West, North and South of England. In London, income paid to providers in tuition fees increased but at a steadily decreasing rate across all six years. The gap between the level of income from loans and from grants was consistently larger in Scotland and in Wales than in England over the six year period.
The Russell Group overtook University Alliance as the group teaching the most students back in 2014. Most groupings have seen overall growth since then, with the exception of Million Plus. It is notable that alternative providers currently teach three-fifths of the number of students taught by further education colleges – both groups have grown.
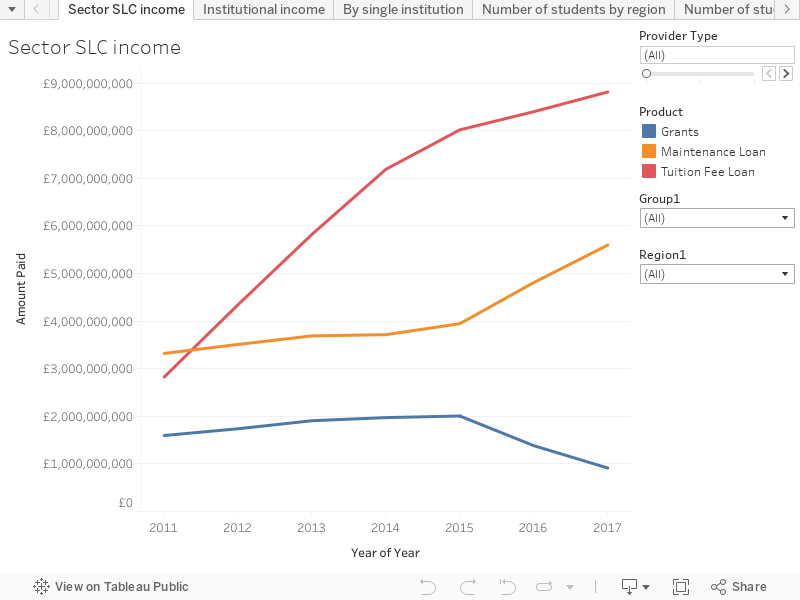
There are five tabs on the visualisation – the first shows the income relating to whole sector in each of the three categories above. You can filter by provider type – a choice of “public” or “alternative” from a field assigned by the SLC, or by the usual Group and Region fields.
The second tab shows a table of data by institution. The colours indicate the amount of funding under each category – and you can filter as above.
The third tab allows you to look at income relating to an individual institution – note that the SLC data shows historic names as a separate institution, even though the UKPRN remains the same – so although you search by institution, the table is actually organised by identifier.
The final two tabs use the available data on the number of students that accessed SLC support each year – by region and by group.
Data visualisation by David Kernohan.


