


We’ve come to know the HEPI/Advance HE student experience survey well since it began in 2004.
In many ways it is one of the best sources of information we have about the student experience. It focuses on what students at all levels of undergraduate study have experienced during higher education – both general impressions and specifics.
The survey remains the only source of information we have on contact hours – a measure once deemed important enough to feature in a predecessor of Discover Uni. But the main value for money metric is the one that sees most attention – the statistically significant 2 percentage point drop in “good” or “very good” ratings between 2019 and 2020 (from 41 per cent to 39 percent, the latter still above 2018 figures) will make headlines, with the caveat that experiences were shaped by strike action and the early days of the response to Covid-19 will fill in the detail.
But is this right? Let’s have a look.
What is “value for money”?
The factors influencing perceptions of value, as always, are telling. Students who report a good or very good experience tend to cite teaching quality, facilities, and course content as key influences on this perception. Students describing their experiences as poor or very poor tend to cite one-to-one tuition time, the cost of living, and contact hours more – but overwhelmingly reports of a poor value experience are linked to concerns around “tuition fees”. This year “other” issues, such as Covid-19 and industrial action, have played a larger part – though this is an order of magnitude less important than perceptions around fees.
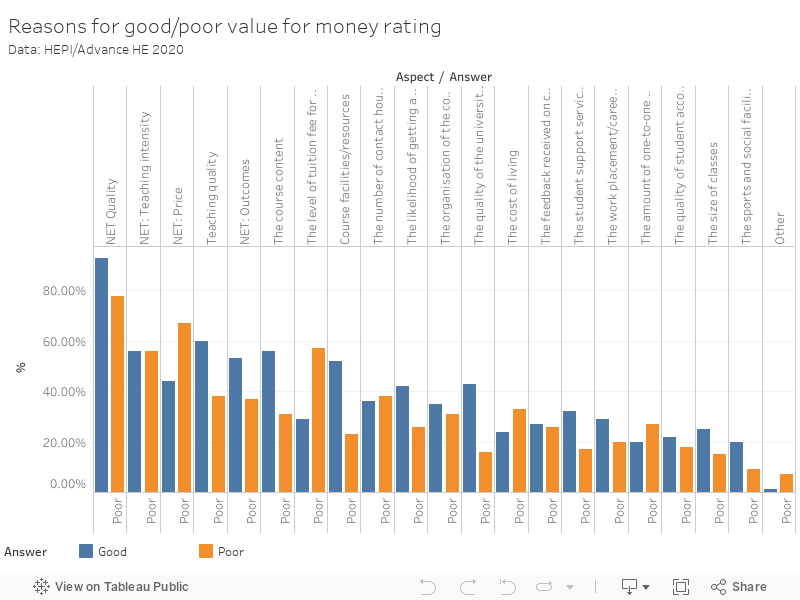
Here we reap the whirlwind of messaging aimed more at commentators than students – a form of buyer’s remorse. Even if the purchase is a good one by other measures, the perception that you have paid over the odds can sour it.
For instance, there is evidence that students are beginning to understand the importance of the fee income has strategically to universities, with a small but interesting rise in acceptance of provider spending on student recruitment, local community investment, and research staff. However the suggestion that just 58 per cent of students (down from 60 per cent last year) feel that teaching facilities and resources are a reasonable use of student funding should give us pause.
When we look at a linked but distinct measure – student experience compared to expectation – we see a statistically significant rise in the proportion of students suggesting that experience has exceeded expectations, 22 to 26 per cent in a year. This is the same sample that generated the value for money drop headlines – but are they somehow also reporting a better experience against expectations?
Let down by the sample
However compelling the argument is that there has been a fissure between value for money and student satisfaction – we simply don’t have the data to know for sure. Students from better off backgrounds (AB social grade, private school) are more likely to report a “better than expected” experience.
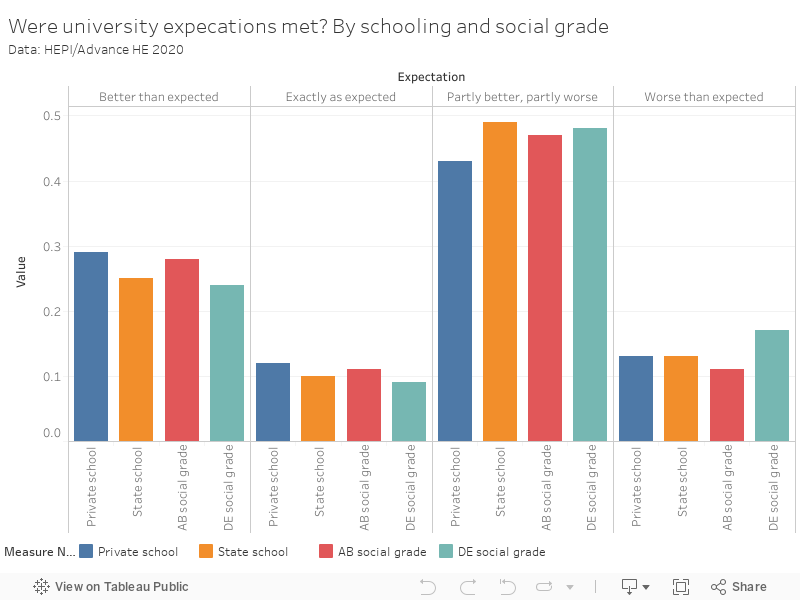
Drilling into the splits is always interesting with this survey. In the three years I’ve been writing about this survey release for Wonkhe, I’ve unfailingly taken the HEPI team to task for neglecting to weight the sample by school background and social class. There are arguments not to do this – too much weighting can cause as many problems as it solves – but when you see tables like the above it should give us pause.
Nearly 20 per cent of this sample went to private school – compared to 7 per cent of the student body nationally. Forty percent of the sample came from settings with an AB social background – compared to around 27 per cent of the UK population (university students are more likely to come from AB social grades, but IMD data suggests the trend is not as stark as this sample suggests).
This makes it very difficult to be comfortable in assuming that this sample is representative of the wider student body. The sheer number of people surveyed (10,227) does help, but not enough. We know that students with a private school background have a very different experience of university (and of life, frankly!) – the HEPI/Advance HE itself survey speaks eloquently of this.
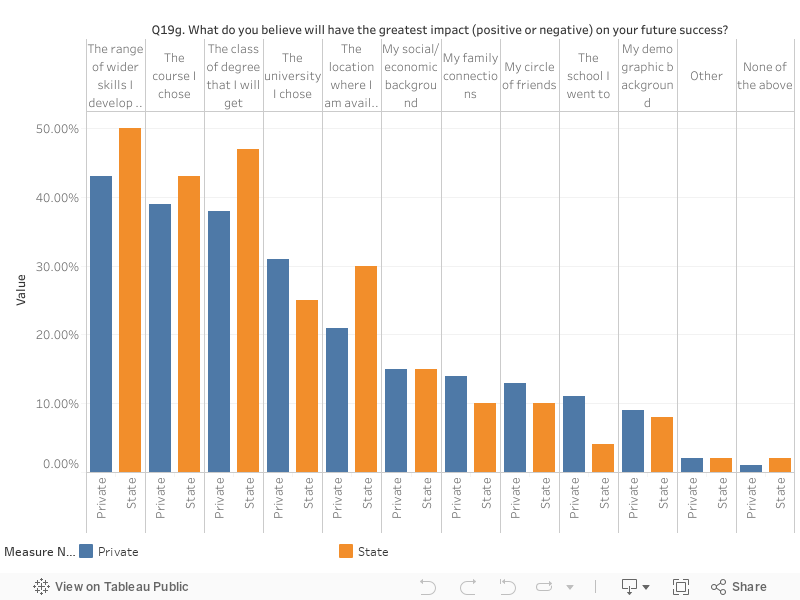
Students from a state school background are more likely to cite the social mobility impacts of academic work in thinking about influences on their future success, while private school students are more likely to cite their choice school or university. The difference is small, but significant. If we are dealing with two different conceptualisations of the point of university study (and two different worldviews) then we run very quickly up against the limitations of the weighting.
We need to talk about race and experience
Students from Black, Asian and minority ethnic (BAME) backgrounds continue to report a lower perception of value for money, experience over expectation, and confidence in their retrospective choice of course and provider. There’s a very slight rise in BAME students reporting they have “learned a lot”, the closest of these measures to the white experience (60 per cent compared to 64 per cent). The choice of university question shows a particular detriment for Black students – only 45 per cent would choose the same course and university again (with 14 per cent regretting choosing higher education altogether), compared to 68 per cent of white students.
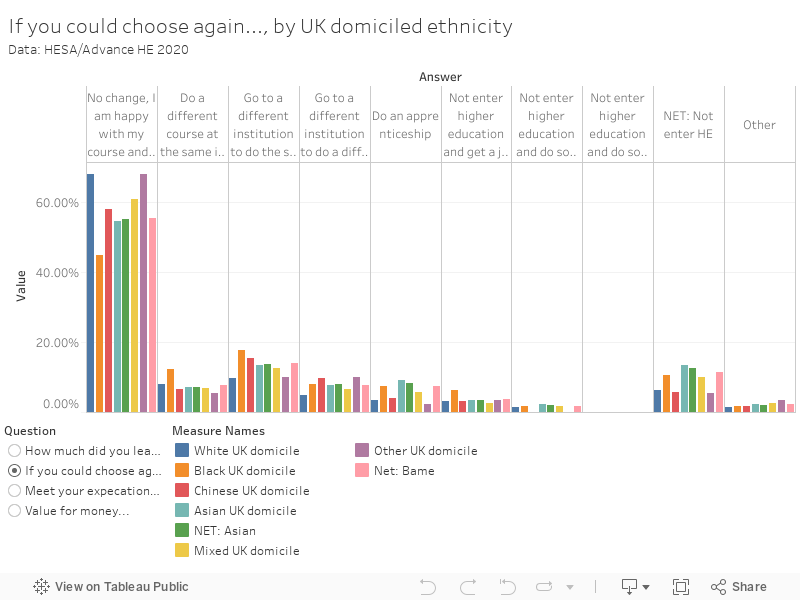
The survey report notes that Black students are more likely to be in paid term-time employment than other groups, and that paid employment is linked to a less positive experience of university. While there is a detrimental effect on these responses for the growing number of students working during term time, we’re looking at a 10 rather than 20 percentage point difference. Clearly something else is going on too.
Wellbeing, LGB+, and preparation
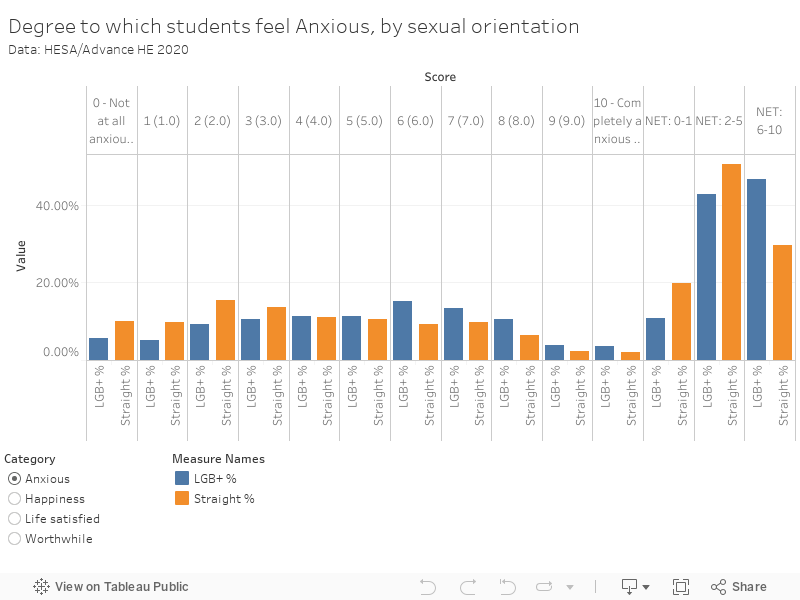
We’re presented with concerning evidence that students are – on average – less satisfied with their lives, less likely to report their lives are worthwhile, less happy, and less likely to report low anxiety. On each of these measures other than low anxiety a further drop this year continues a five year downward trend. Just 11 per cent of students now score their life satisfaction at 9 or 10 out of 10. The report notes that this is despite what appears to be a genuine and extensive sector focus on student mental health.
Incredibly, these figures are worse for students with lesbian, gay, bisexual, asexual, or other sexual orientations. It is important to note that these figures do not include trans/non-binary students – this survey has never collected data on these groups, though I am assured that this (along with sex as a binary choice) will change in future. Life satisfaction (scored at 9 or 10) drops to just 7 per cent for LGB+ students – 9 per cent report that they feel their life is worthwhile.
The same bank of questions also shows a significant difference on life satisfaction and anxiety for students who feel prepared (both for university and “the future”) and that report having learned a lot – such students are more satisfied with their lives and happier. Of course, this neat overall finding is ruined by the realisation that prepared students are much more likely to have been to private school and have an AB social grade background.
The report describes this effect:
“The salient point here is that rather than students directly saying that their background will impact on them, this is based on implicit perceptions. This in turn may be influenced by a level of confidence, or understanding of how to tackle the future, that students from a better off and / or private education background may feel has been instilled in them somewhere along the line.”
Again, I wish the sample had been weighed by these factors – currently the overall figures are likely to be unrepresentatively high because of the larger than expected private school student response rate.
Technology, and Covid-19
Part of the benefit of HEPI involvement in this annual survey is that each year the question bank is expanded to look at policy questions of the day from a student perspective. In previous years these have been hit and miss, and 2020 is no exception. It is reported, for example that only 7 percent report that “advanced technology” is in use, whereas 90 per cent enjoy only “basic technology”. This would be a fascinating finding – but the meaning of “advanced” is set by the student, making the question an effective measure of how impressed students are by technology.
The bad news for the burgeoning technology industry is that students are hard to impress. The “advanced” technologies cited are hardly unusual – one of them is BlackBoard (despite virtual learning environments like BlackBoard being prompted as “basic technology”), another is lecture capture. Nearly all providers use these or similar technologies, and have done – in the case of BlackBoard – for more than a decade. Those students who are impressed by such technology tend to be more impressed with other areas of provision too, so there’s that.
Many headlines will feature differences between responses to the survey pre-lockdown (before 16 March) and during it. The split by date has never been done before with this survey – but we now know that people that respond later to the survey are significantly more likely to be male, more likely to have entered university via clearing, and more likely to (you guessed it) have attended private school.
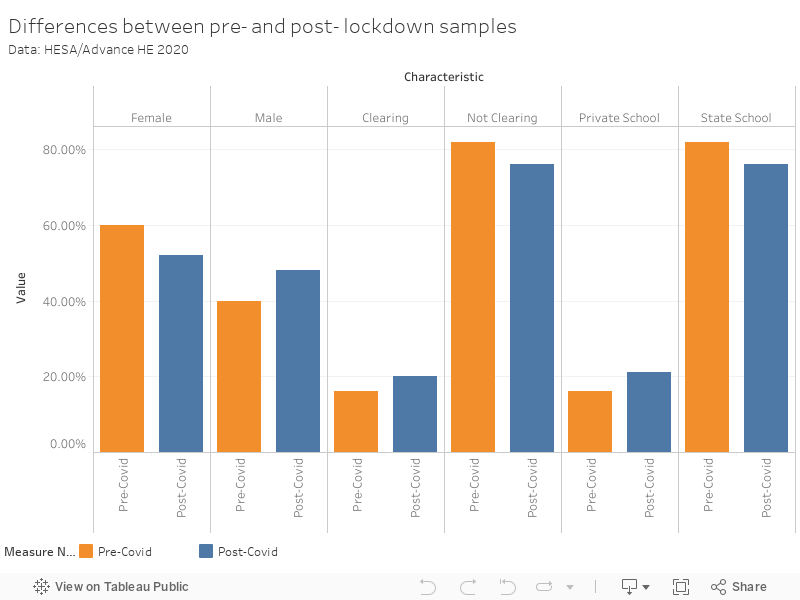
A sensible way to get around this problem would be to treat the responses as two separate surveys, and carry out basic weighting so they were comparable both with each other and with the wider student body. This is not what has been done – so it is difficult to tease out how meaningful changes between responses across the two chunks of the survey are.
For instance, good or very good value for money is reported by 40 per cent of respondents before 16 March and 38 per cent afterwards. This dances on the edge of significance, and the effect of the lower ratings from the later cohort is probably what has pushed the headline number down. However – the earlier cohort is 60 per cent women, and the latter is 48 per cent men. Because women are slightly more likely to report good or very good value for money, this means that we cannot be clear that Covid-19 is the cause of this change. Which is a real shame, as that would have been a fascinating finding.
Likewise, the later cohort of responses was significantly more complimentary about three key aspects of teaching and staff support – staff initiating discussions, staff guiding and supporting independent study, and staff helping students explore their own area of interest. A lockdown impact? We don’t know.


An interesting item, it seems to me that poor preparation by state schools and colleges is still a major problem, with British black students apparently reporting needing but not getting enough contact time to support them more than white and other BAME students “They are also less satisfied with access to teaching staff – a key aspect that may well be contributing to some of the measures charted here”. As a number of black and other BAME commentators have noted recently there is an element of black community criminal hero worship that disaffects those that study supported by ‘good’ teachers, get good grades and go to University.
I also suspect there’s ‘buyers regret’ expressed by the few, unless statistically corrected for such a small group within the overall British population, the collection and correction methods applied aren’t clear to me, is probably similar to other groups, though those other groups may not express it so willingly so as to save face.
With some overseas black students confiding to me they are concerned that British black students don’t know how good they have it yet expect to be pandered to and handed things on a plate, I’m concerned that any further ‘support’ must not further depress and infantilise British black students, going to University isn’t just about learning but also growing up and becoming a critical thinker, not making people of all backgrounds even more ‘dependent’ upon the University, or the state.
Thanks David. I always enjoy your forensic assessments but particularly so when they are on our Annual Survey – which is why we always strive to share the complete, large and weighted dataset with you, even before publication. I too find it incredible that the Survey remains the only reliable place to obtain information on crucial topics like contact hours and other measures of student workload.
But we shouldn’t lose sight of the forest by obsessing over each tree within it.
We are always keen to look at further improvements to the Survey, and we try to make some positive tweaks every year. But I think you slightly overdo your case. For example, while it is true that at one moment in time independent schools educate close to 7% of all pupils in the UK, this number is meaningless when it comes to conversations about access to higher education – in other words, the proportion of people who enter higher education having had recent experience of an independent school is materially higher than 7%. This is doubly true if you include, as you probably should for a fair analysis, anyone who has been educated in a private institution for a lengthy period of time during their schooling, including those who may not have taken their Y12/Y13 assessments in one – the Will from Inbetweeners effect. Indeed, I generally regard the 7% number as both the most well known but also the most often mis-used statistic in education policy.
Moreover, it remains true that, for people who are interested in the student experience cut by school type, this year’s HEPI / Advance HE Student Academic Experience Survey report actually has more to say on the issue than in any previous year. For anyone who wants to know more, please do take a look at: https://www.hepi.ac.uk/2020/06/11/better-assessment-impresses-students-but-covid-19-impacts-perceptions-of-value-for-money/