It’s the annual A level jamboree, where hard-working students across the land are told their efforts are less worthy than their predecessors.
Some 18-year-olds will have secured their dream ticket today, some will be frantically searching for theirs, while the majority will be looking on nonplussed.
Institutions (and this year, it will be nearly all institutions) will be looking nervously towards their fortunes in clearing. It’s a good year to be a prospective applicant, with places available nearly everywhere. But is it evidence of a fully functional higher education market, or just a grim battle for viability now the caps are off?
The results are in
Overall, today’s A level results are relatively “stable” compared to previous years, especially considering the reforms that are still working their way through the system. However, the dark arts of grading always partly ensure that this is the case. According to the Joint Council for Qualifications (JCQ – a coalition of all the awarding bodies), grade boundaries are set each year for each subject to “maintain standards and allow for year-on-year differences in papers and questions”. This combines data such as prior student attainment with “expert judgement” of students’ performance. The regulator, Ofqual, uses the “comparable outcomes” statistical methodology to ensure fairness to each cohort.
The reforms started under Michael Gove were apparently “to meet the needs of higher education”, including more maths in geography and more examinations over coursework- although he’s not exactly famous for being the sector’s friend. Much of the changes were made before 2015 through the A Level Content Advisory Board(ALCAB), in consultation with (some of) the sector. However, some people will distinctly remember the approach taken by the Department for Education (DfE) during that period, especially Gove’s special advisers. The reforms also make year-on-year comparisons tricky, for instance with AS levels rapidly fading away in England, but still used in Wales and Northern Ireland.
Overall results and by subject, over time
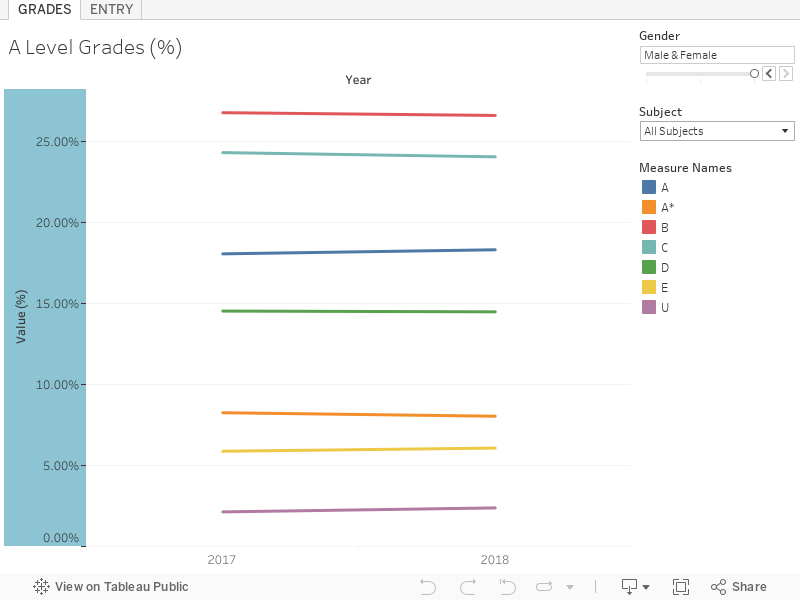
In terms of overall UK outcomes, 8% got an A* (-0.3% on last year and the lowest since 2013), 26.4% got A*-A (up 0.1% on last year and the highest since 2012), 97.6% got A*-E, -0.3%. 8.5% of males got A* (-0.3% on last year), and 7.6% of females did (-0.2%).
Of particular note is plummeting numbers of students taking modern languages, with Spanish, French and German all down. Chinese is now more popular than the latter, with Russian also seeing an increase. This continues a years-long trend that also reaches into higher education and beyond. So far policy interventions have had little effect – maybe the idea of all those trade deals to negotiate around the world will focus governmental attention a little bit.
The gender split in subject choice is remarkable. Mathematics is the most popular subject for males, whereas Psychology is the most popular for females.
There continues to be an increase in entries to “facilitating subjects” (52.5% this year, 51.7% last year), in part driven by the government’s – eerily similar – EBacc performance measure for schools. However, that rise hides considerable variation. STEM subjects continue to increase in popularity, taken by 36.2% of students this year. Maths is up 2.5% and computing 23.9% (though from a very small base). STEM subjects are still more popular with males (45.9%) than females (28.3%), though that is slowly changing. Males outperform females in maths and chemistry, while females perform better in design and technology, physics, computing and biology. By contrast, humanities subjects decreased in popularity, with history down -2.7%, English literature -4.6%, and geography -11.3%. After enquiring we were told that arts subjects were for a “small but steady” group.
Meanwhile, at UCAS
The total number of UK entries (811,776) continues to fall (-2% this year, -1% in 2017). However, this is at a slower rate than the fall in the number of 18-year-olds (-3.5%, -1.7% in 2017). This makes for a record proportion of 18-year-olds entering higher education in England (27.9%) and Wales (26.3%). The figures in Northern Ireland (28.1%) and – from last week – in Scotland (25.9%) are high, but not records.
So far 353,960 people across the UK have been accepted, 2% lower than last year. Of those accepted, 88% will be studying their first choice course.
Offers and clearing
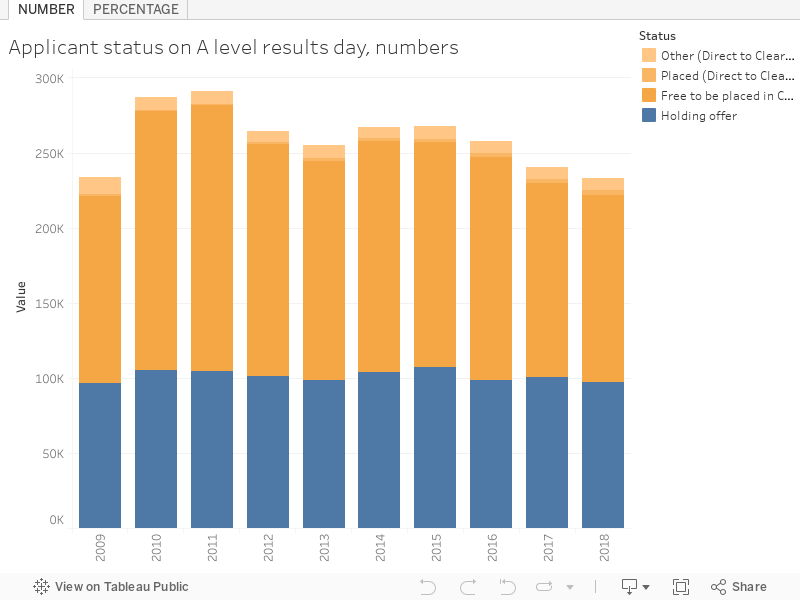
The chart above shows the proportion of students going into clearing over the last decade. In 2018 slightly fewer students hold offers (97,330) compared to last year (-3.07%) – though this needs to be considered in the context of slightly fewer 18-year-olds and applicants. Last year 66,865 people were accepted through clearing, with 16,950 of those applying directly once they got their results. At nearly all institutions, clearing is an always-on process, becoming ever-more agile and data-led.
Placed students (16 August) by subject, over time
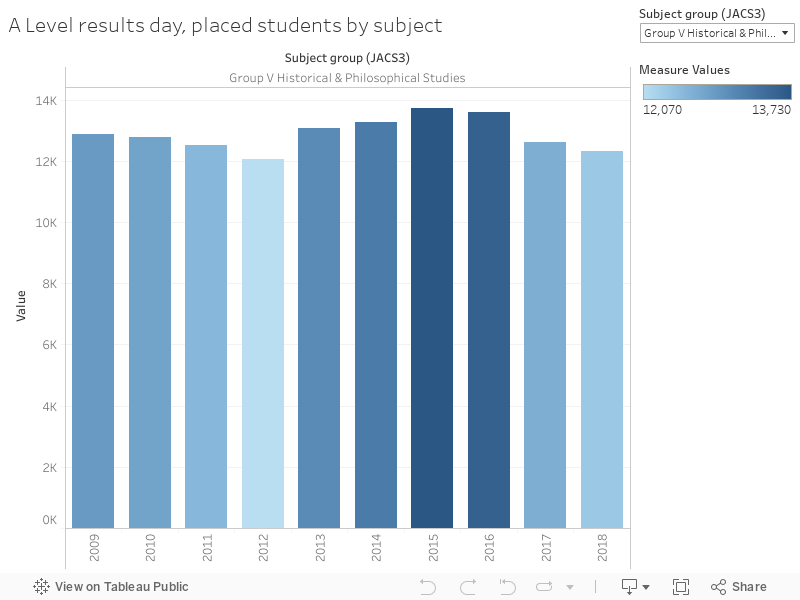
The above chart shows the volumes of students over the last decade placed in each group of subjects, as defined (still!) by JACS3. Note that subjects allied to medicine, which includes nursing, has fallen by 2,010 students (-4.7%) over the last two years, to 43,150. Similarly, those studying education have fallen by 680 students (-4.8%) since 2016, to 14,780.
Placed students by POLAR3 quintile (a proxy for disadvantage and low HE participation)
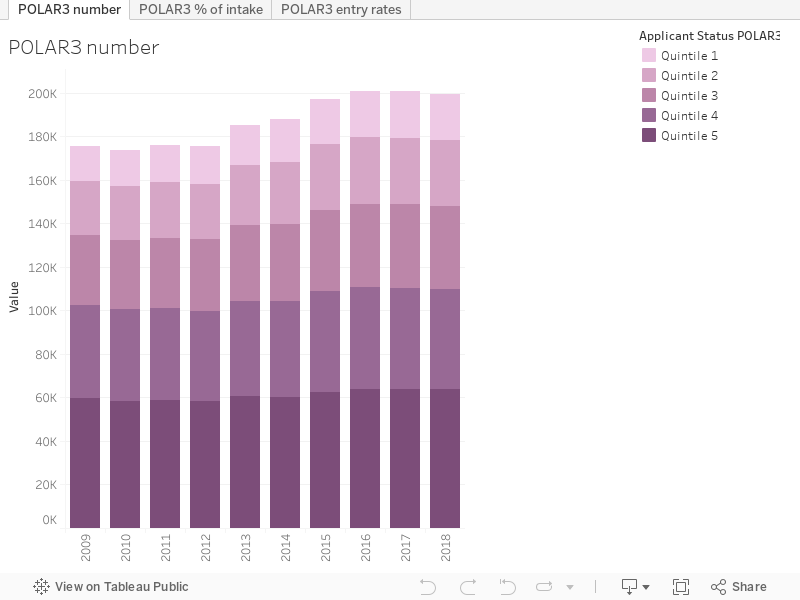
A record proportion (16.1%) of disadvantaged students have been accepted, 0.4% more than last year. But disappointingly, the gap between advantaged and less well-off students entering university hasn’t changed much since last year, with some social mobility in the wrong direction. Those from quintile 1 areas (with the lowest higher education participation) have fallen by 260 (-0.4%) while those from quintile 5 (highest participation areas) have risen by 1,000 (0.27%).
Placed students by region
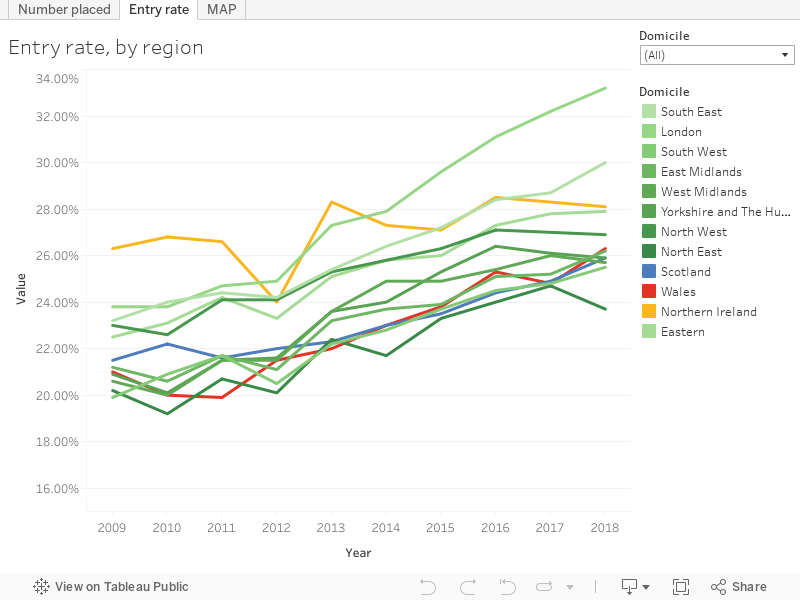
The CBI has been making a lot of noise about regional inequality this year. 2018 has not been great for young people in the North East, with a sharp downturn in entry rates (one whole percentage point) since this point last year. We also see – albeit smaller – downturns in Yorkshire and the Humber, and the West Midlands. Meanwhile, London and the South East continue to power ahead.
Scotland once again dips below Wales as the region with the lowest participation rate at this point in the calendar, after participation in Wales climbs by one-and-a-half percentage points. Clearly, the post-Diamond settlement is proving attractive.
Further afield, 26,400 EU students have been accepted, an increase of 1%, alongside a record 31,510 (+4%) international students from outside the EU.
The media coverage
As is often the case at Wonkhe, we feel confident we could write each newspaper’s headlines in advance whatever the actual story. Today the Telegraph goes with “Highest number of top grades for six years despite new ‘tougher’ exams”, while the Guardian trumps for “Proportion of students in England getting C or above falls”.
But, be it grade inflation, constant reforms or artificially high barriers, we should keep in mind that these results represent the culmination of years of very hard work for hundreds of thousands of people.
Bonus content
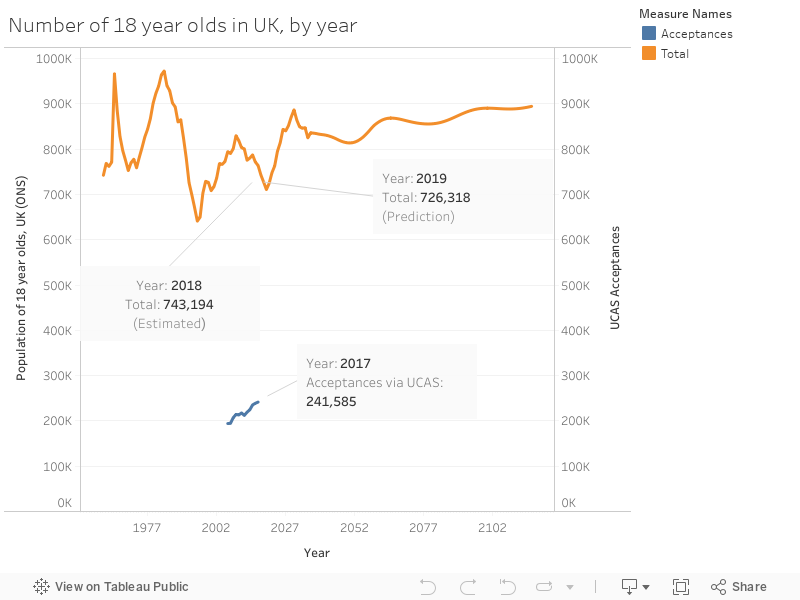
A number of people have been talking about the demographic shift today – basically the variation in the number of 18 year olds year by year. We’ve gotten estimates (based on actual data) and predictions (based on fertility, family size and immigration trends) from the ONS, and graphed them alongside acceptances (end of cycle, so I haven’t got 2018). As can be seen, there are still plenty of 18 year olds out there to recruit!