


Twenty-five years ago it was very easy to understand how much government funding was supporting students in each subject area at any given institution. A simple glance down the Higher Education Funding Council for England (HEFCE) grant tables would suffice… though there were deeper questions of cross-subsidy waiting to trap the unwary.
Back then, of course, we had an English higher education system that was largely planned – with only minimal movement in student numbers permitted – and largely paid for upfront.
To answer the same question in 2019 takes an Institute for Fiscal Studies (IFS) crack team of highly trained economists, a raft of specially prepared administrative data, and salary projections extending 30 years forward.
Degrees of difference in distribution
A word of caution at the outset. Estimating loan subsidies is an inherently speculative exercise. It requires the forecasting of earnings of graduates over a 30-year period and economic forecasts. The authors bear this in mind as they make their conclusions.
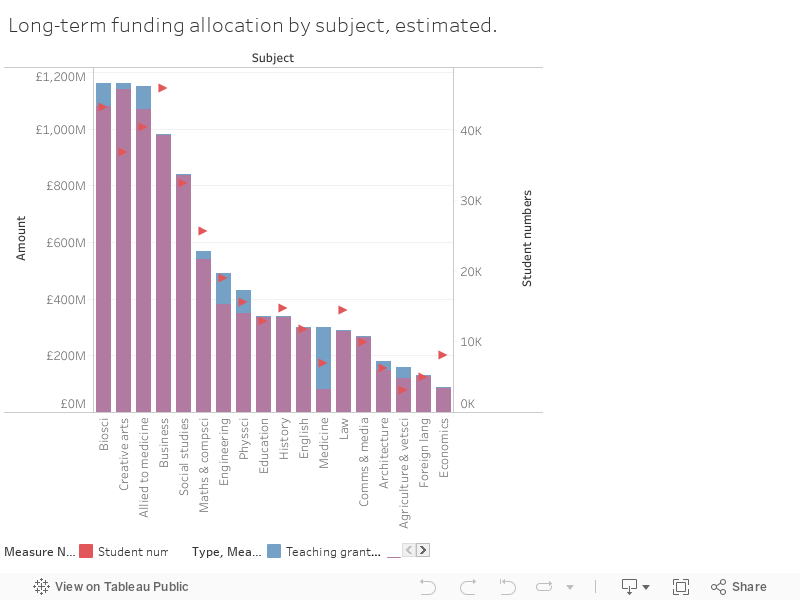
The report calculates the value of the long-run cost to government of higher education as being around £9 billion, with more than $8 billion coming through tuition and maintenance loans that are not repaid. It calculates this amount as the sum of all upfront spending on grants and income contingent loans, as well as the part of student loans are not repaid. This is based on predicted lifetime earnings and repayments to government. Understanding how this money is being spent, by subject area, across institutions, and the broader implications of these factors is the focus of this report.
The major finding from this work is that there is considerable variation in government loan subsidies by subject area. While this is not new information to those in the sector, it lays out quite plainly the different amount of money that the government is expected to write off. For creative arts, the government is expected to pay off 75% of the subsidy – whereas for medicine and dentistry, a fifth of loans are expected to be written off.
What this means is that the subjects with the highest loan write-offs typically receive the highest government spend per student. An exception to this is medicine and dentistry, which has a low loan subsidy despite being one of the higher-cost degrees to government at £45,000 due to the large teaching grants.
They also posit that the differences in loan write-offs across subjects largely reflect differences in loan repayments, rather than in the differences in the size of the loans. As annual tuition fees are the same (at £9,250) for the majority of students, the size of the loan is calculated on the length of their course and their parental income.
The government cost per student also varies by institution type. As students from Russell Group universities typically tend to have higher earning, the government cost per borrower is around £24,000, whereas in post-1992 and other universities this cost is at £31,000. It is worth noting that the total funding received by these universities is largely similar. The differences exist in total cost to government, including contribution towards living costs.
We ❤ the 90s
HEFCE did used to steer the subject (and by extension institutional) shape of the sector after a fashion, but were very careful to give the impression that planning was very much only a last resort. 1998 saw the inception of £1,000 fees, but also the birth of a shiny new funding system – the last vestiges of which can be seen today in the OfS’s high cost allocation system.
Drawing on TRAC(T) data on academic workload and the cost of delivery, four subject price groups provided multipliers (A=4.5, B=2, C=1.5, and D=1) for a standard unit of resource (at the time £2,662 per undergraduate per year, plus the £1,000 fee income – which would be around £ 6,555 in 2019). Additional twiddles at a student and institutional level resulted in a final institutional allocation.
Combining this with student number controls meant that to a certain extent, the subject mix studied by the student population was pre-set, though tolerance bands meant that historic values were deemed generally to be the correct ones. HEFCE did offer the opportunity to bid for extra places where it saw a strategic need, which ensured that state-sponsored growth mostly happened in the “right” place. As planned systems go it was more Mr Bean than Stalin, if you will. Here’s an (indicative, very rough) equivalent to the graph above.
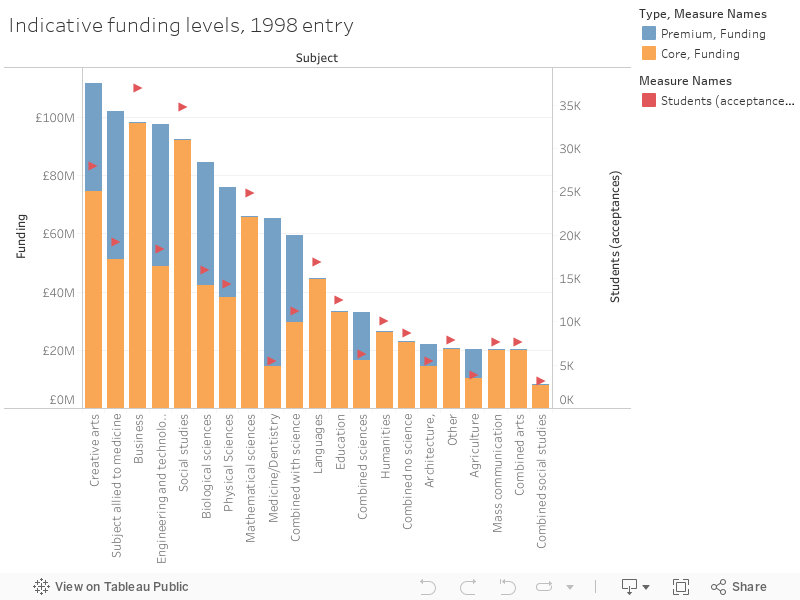
(You may note that student fees are not included – in 1998 fees would have been paid up front with no fee loans available, and some subsets of students were exempted).
Bringing some order
Thanks to Augar and the Office for National Statistics ruling, every penny of outlay on higher education now is vividly scrutinised. There’s been a sub-theme developing on whether certain courses, institutions, or even students are suitable for student funding. Previous IFS reports looking at LEO data set several hares running about “useless” courses or institution – and while IFS themselves were keen to point that there was also a social benefit to higher education, by the time this got to ministers and commentators this caveat became a single throwaway line to get them past difficult questions on why society so poorly rewards teachers, nurses, and artists for the vital work they do.
By highlighting the differences between current and postulated models of graduate contribution, we see unmanageable variation in the system – which prompts us to recall that this (according to the architects of the idea) is a bug not a feature. Funding is, by design, led by student demand. What we are really critiquing is not a ministerial choice but the aggregate life choices of a generation of young people.
This report essentially concludes that under the current system, the government has little to no control over the distribution of its spending, with the vast majority of it mechanically accruing to those with the lowest lifetime. If there were to be a significant increase in the number of students doing subjects that lead to low lifetime earning, then this could spell an increase in government exposure to financial risk.
One solution outlined in response is that of “negative teaching grants”, where institutions would pay for the right to teach students on subjects where low repayment rates are expected. Another solution would be a return to late 90s style semi-managed allocations – although as we’ve shown, this doesn’t necessarily equate to government skills priorities being met – though it would work to control funding to an extent.
So the bigger task for Augar’s report is to make a decision regarding how much agency young people have in the post-compulsory system. A planned system could have clear financial efficiencies alongside the wider benefits to the range of skills found in the future UK workforce. But such planning has to be underpinned by a set of predictions about the many forms of return on educational investment that are better than those delivered by the consolidated opinion of a couple of million 18 year olds each year.


Perceptive analysis, thank you: “What we are really critiquing is not a ministerial choice but the aggregate life choices of a generation of young people.” TRAC may or may not encompass all institutional costs (not sure whether/how it treats e.g. NPV of future liabilities for debt repayment these days) but costing by subject must depend on overhead apportionment within institutions, which should remain a strategic choice for the institution rather than being externally determined. If the market is really to operate then politicians will need to accept that significant parts of the country will become deserts of scarce opportunity for many subjects, damaging local economies and social mobility as institutions cut back or close down.
If a key driver here is student choice, and IF there is any role for society to support those choices, you might wonder whether informed “life choices” were more influenced by activities at school or by providing a better framework for technical education to provide a wider and more attractive range of choices.