


A new year brings a new format to the annual release of end of cycle data from UCAS.
We get the first chunk of reports today – with additions on 17 December (sector level data) and 30 January (institution level data). Today is all about summary reports, with information of particular interest on Clearing and nursing courses. There’s also the first of a crop of insight reports, entitled “releasing ambition”. But what can we learn from this first crop of 2019 cycle data?
Self-release
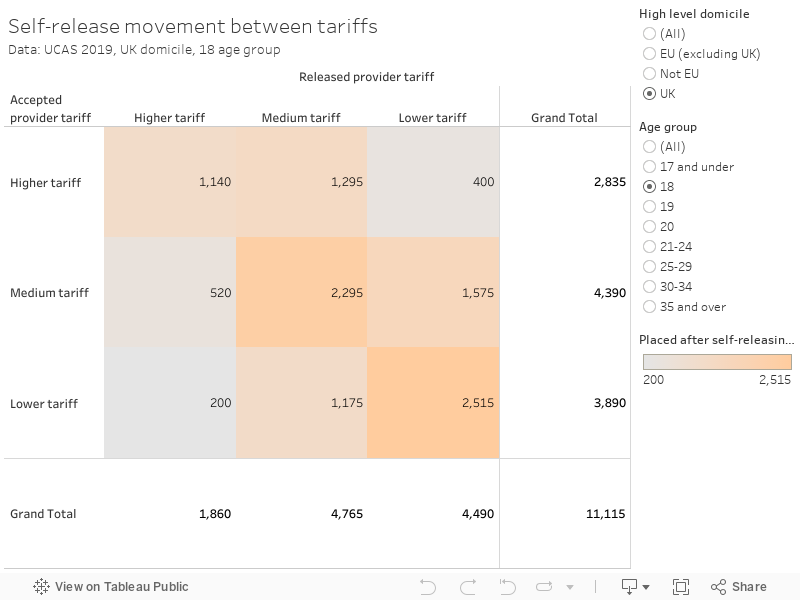
New for the 2019 cycle was the ability for students to “self-release” from confirmed places after A level results. The intention was to see students trade up to more selective providers – 28,030 applicants self-released, but only 18,955 subsequently applied to another course in clearing. Of these, 73.3 per cent were accepted onto a course they had not previously applied to – 9.3 per cent applied to a course they had previously declined an offer from.
This does sound like consumer choice in action – although the number of applicants that self-released and did not subsequently accept a place in HE is surprising, and no explanation for this behaviour is suggested. In terms of movement between tariff bands we are not seeing the kinds of “trading up” that was widely predicted – in the main applicants are remaining within an existing tariff band. This suggests that applicants are changing their course and provider for reasons other than a perceived prestige.
How easy is it to get a university place?
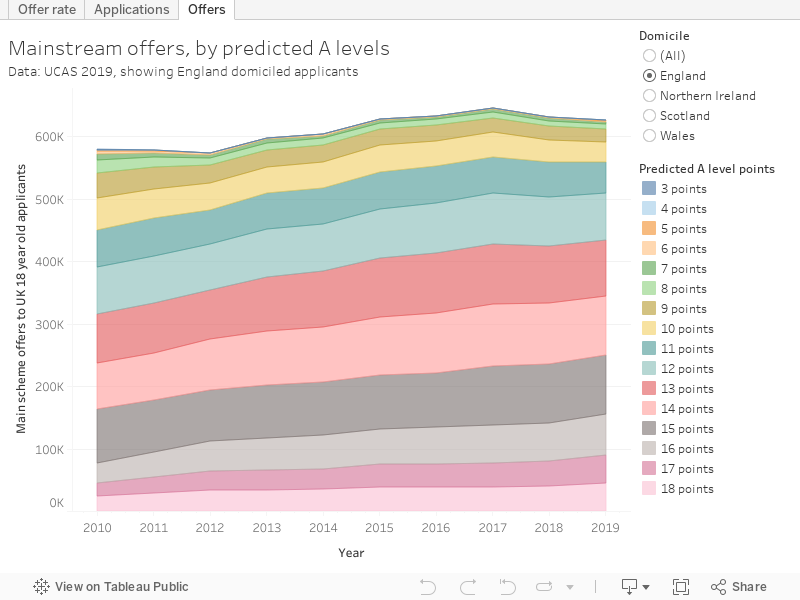
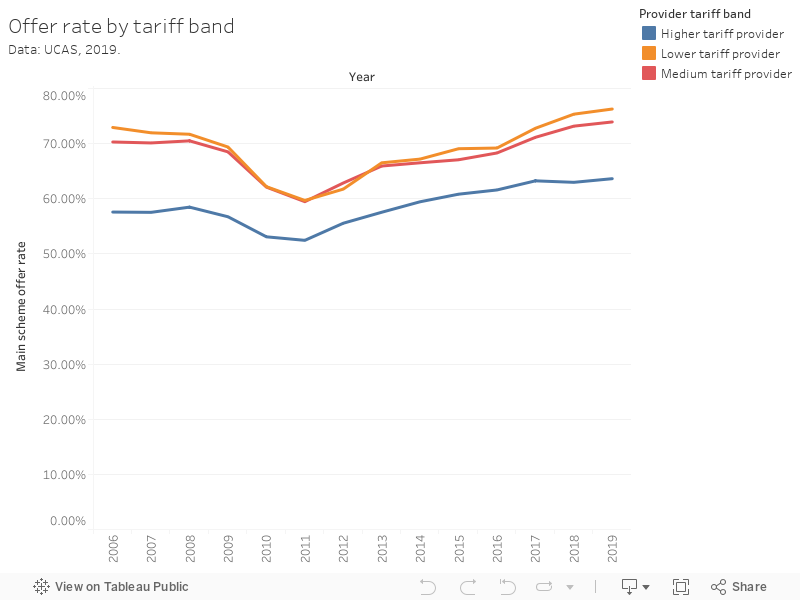
Easier than you might think. The offer rate (the percentage of applicants that get at least one place offered) has grown slightly, and the acceptance rate (the percentage of applicants that will enter HE) has marginally fallen – now standing at 76.6 per cent. But you can see offer rates growing at lower predicted entry tariff points, suggesting contextual offer making is having an effect.
A failure to achieve expected qualifications is not the barrier many assume – 49 per cent of all accepted applicants do not get their predicted A level grades, and this rises to 60 per cent of applicants from low participation areas (POLAR4 quintile 1).
Here we can see contextual offer making in action – although it is suggested that applicants from low participation areas are less likely to be aware of the practice, a lack of knowledge that could be putting them off applying to more selective providers.
But the offer rate is growing across providers in all three tariff groups, a trend that started in 2011 with the onset of competition in the English sector
Changing subjects
Changes in subject areas of study continue trends from previous years, though there has been a notable uptick in those accepted to study subjects allied to medicine.
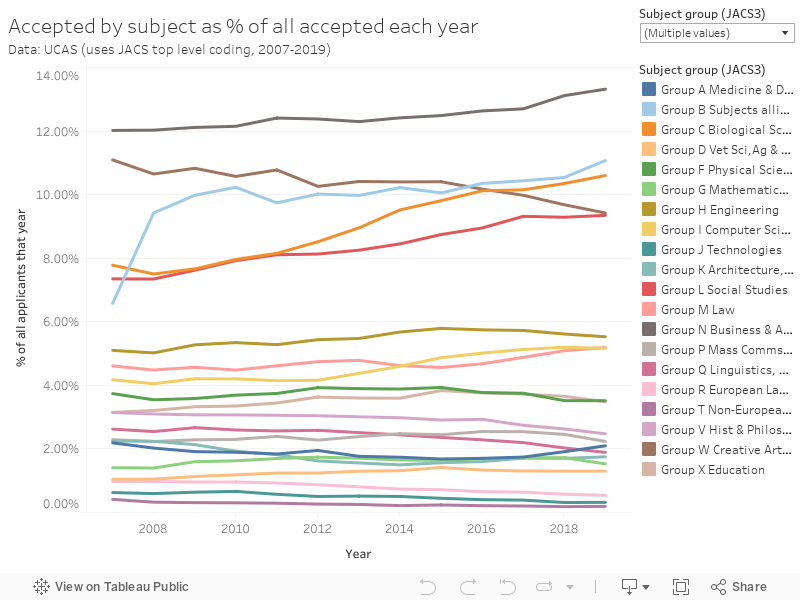
This is an interesting finding – parts of it are due to us seeing a small resurgence in nursing applications in England, with a record high representing a England. This was a record high, and a 6 per cent increase on 2018.
In all 30,390 people were accepted on to UK nursing courses in 2019 – with the number of applications rising 6.7 per cent to 54,225. You’ll recall our concern about low demand earlier this week – it seems that recent recruitment campaigns are beginning to have an effect.
Mathematical sciences saw the largest proportional fall (of 9.9 per cent) to 8,285. This is the lowest number of accepted applicants in this subject group since 2012, and coincides with the launch of the new maths A level, which saw nearly 6,000 fewer students taking the subject in summer 2019.


All of the above needs to come with a massive health warning that it looks at *full-time students only*. It’s especially odd for UCAS to make conclusions about mature students based on UCAS data given a majority of over 21s study part-time despite the post-2012 collapse in part-time HE.
Once you include all students, their headline-making statements about big increases in students from “disadvantaged backgrounds” (sic) are not true – there’s been a roughly 16% decline on the POLAR-based measure they use https://wonkhe.com/blogs/is-there-really-a-record-number-of-disadvantaged-students-in-he/
Annoys me massively every time there is a UCAS press release and reporting of it that doesn’t explicitly state just how many students are excluded and how different the trends are once they are. It makes a huge contribution to the institutionalised blindness to flexible learning in England and the fact the 40% decline in mature student numbers since 2011/12 went unremarked for so long (e.g. the success of the 2012 reforms as they were rolled out were monitored by HMG solely using UCAS data).
Yeah, as usual UCAS data includes only students that apply via UCAS. It’s annoying – the framing of “this is most students” is only true in select circumstances. It’s almost completely useless for Scotland, for example.