


Are different demographic groups of students more or less satisfied with their courses?
A new OfS data release aims to find out – looking for the first time since 2014 at National Student Survey agreement data (2018 and 2019) for each question and grouping by age, subject of study, mode of study, ethnicity, sex, and disability marker. Pedants will note that we’ve been getting data for some groupings in the TEF data split metric since 2017.
The accompanying insight brief gives a history and overview of the survey (we did it in even more depth here) along with a summary of some common criticisms and next steps – there’s a lot more NSS action to come, as we’ll get to. But it is the characteristics analysis that will see the most attention.
Good character
In a nutshell, OfS makes a data-derived argument that suggests – for example – part-time students lack a sense of belonging, Asian and Black students are less likely to see marking and assessment as fair, and disabled students are less likely to see their course as well organised and running smoothly. Each of these is based on comparing aggregate agreement on appropriate questions against a benchmark derived in the traditional NSS manner.
The OfS dashboard is pretty decent – but this is an easier way, for me, of viewing across multiple splits at a glance. You can filter by NSS question number at the top, and choose the year and domicile at the right. The graph shows the difference between the actual agreement percentage and the benchmark, with colours used to indicate levels of significant (grey is not significant, red is significant at 0.90, orange at 0.95, and green at 0.99).
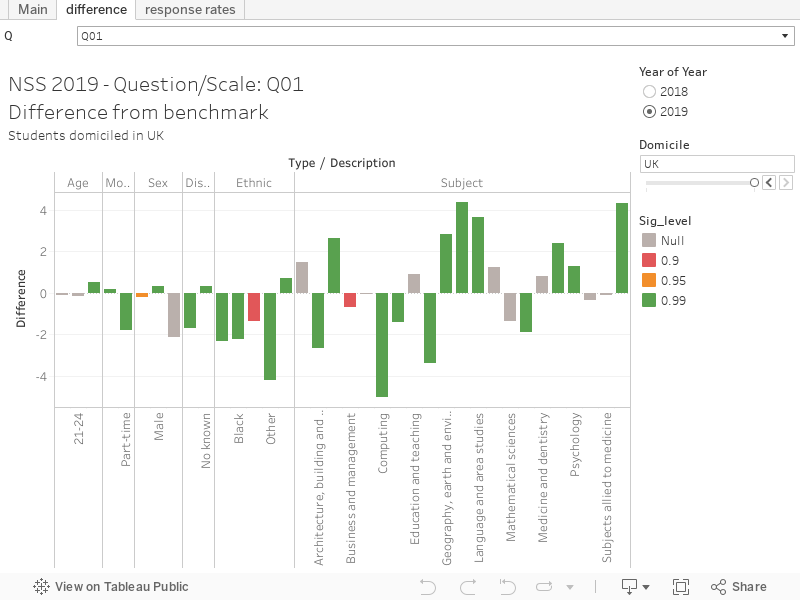
Fans of the OfS regulatory approach will recognise this approach to encouraging providers to act on identified issues – based on spotting portions of a gap between actual and expected values that requires “explanation”. As usual, critiquing this approach properly requires that you dig quite a long way into the data and methodology – but, as usual, that’s what we are going to do.
A sense of proportion
What’s missing for me is any direct assessment of how likely students from different demographic groups are likely to respond to the NSS. This would be a spectacularly useful piece of information for many course and subject leads in universities across the land. While OfS clearly have this data – they would have used it to calculate significance, and they supply the number of students that responded to each question from each characteristic group – they didn’t want to share it.
We are told that response rates below 50 per cent of eligible students are suppressed, and that this has not happened in the current release.
So, I made my own from publically available HESA data. I’ve only done the UK domicile, and I’ve omitted age (OfS use under 20 as a category, HESA only have under 21) and subject (reluctantly – but any mapping between the JACS top level subjects used by HESA and the the CAH top level subjects used here by OfS is only reliable with a lot of work).
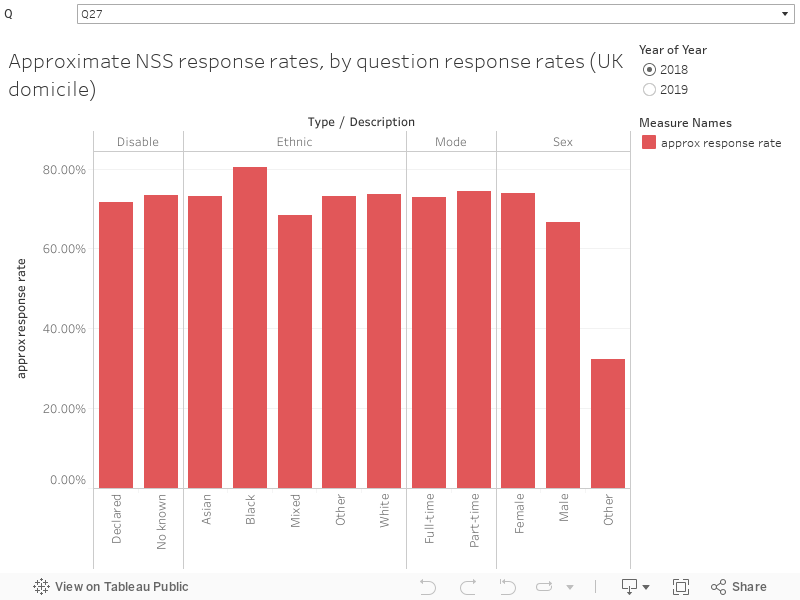
It is, in essence, a comparison between the number from each group that responded to NSS and the number from each group who graduate from an undergraduate first degree that year. We know that in the main students get the NSS in the spring term of their final year, but as this isn’t a universal law (eg sandwich students, who aren’t separated out here and maybe could be in future, have different arrangements). So this is very much an approximation.
What we see is interesting and unexpected. In 2019 Black students are more likely to respond to the NSS than White students. Part-time students are more likely to respond to the NSS than full-time students. Women are much more likely to respond than men, non-binary students are far less likely to respond than anyone. If you look at 2018 the part- time difference disappears, the difference by ethnicity remains.
What’s happening?
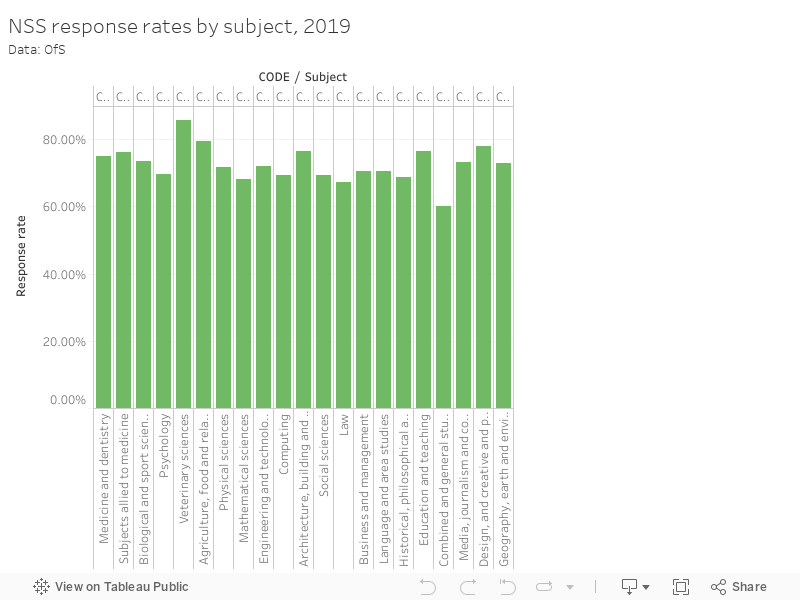
I had to get to it via a round about way but there is a big difference in subject area response rates too. Note, for example that creative arts students are far more likely to fill out the NSS than law students.
This is important because students from a different ethnic background, for example, are more (or less likely) to study some subjects than others. Asian students of Pakistani descent are more likely, proportionally to be studying law than other groups. Black (Caribbean descent) and White students are more likely to be studying creative arts. Here’s some HESA data to remind you:

Note, for example, that 9.6 per cent of Asian students with a Pakistani background are likely to be studying medicine, compared to 2.1 per cent of White students. 4.72 per cent of White students and 5.2 per cent of students with a Chinese background are studying physical sciences, compared to 0.78 per cent of students from a Black Caribbean background.
It’s a fascinating and disquieting plot. Why this is the case requires a great deal of further research – for the moment we just need to be clear that these differences exist.
The benchmarking of agreement rates does factor in these subject-ethnicity differences, and other intersectional clusters. But this data does not benchmark on response rate, which for me is a big problem. If we know -say – that students from a given subject area are less likely to respond, and that an ethnic background of a grouping is disproportionately represented in that subject, then it stands to reason that the response rate for the ethnic background will also be lowered. Or vice-versa.
We don’t know how satisfied or otherwise that students who don’t respond to the NSS are – but I’ve heard it argued that:
- Students who are particularly annoyed by their experience are more likely to complete the NSS (to complain)
- Students who particularly enjoyed their experience are more likely to complete the NSS (out of gratitude)
What I’ve never heard argued is that students who complete the NSS are a representative sample of those who don’t. Response bias is a thing – controlling for response rate would be helpful in managing it.
Why is this important?
You may suspect I’m edging towards arguing “what if we make the student experience better, but in the wrong way”. Obviously I’m not – but the problem with data like this is that providers end up targeting small groups for sustained interventions based on a flawed impression of the poor quality of their experience, while other (harder to identify) groups don’t get the support because their poor experience is masked by being lumped into a larger group of happy students.
The only way to find out if students are unhappy is to ask them, or (if you ask them nicely) to monitor them in other ways. This gives you data that you can act on – and, unlike the NSS, it gives you the chance to do so before the students graduate.
What’s next
This data release and insight brief is effectively a palette cleanser for a review of the NSS – the “biggest since its introduction”. The last review effectively narrowed the exercise to focus on the student learning experience – but now it is owned by the regulator, expect less sector co-design and more use for the regulator’s purposes. We don’t know how that will fit into whatever plans OfS has for the TEF – but we do know it’s intending to ask questions about things like wellbeing and welfare support, and potentially questions on “fitting in”, safety and value for money – all of which were piloted in last year’s PGT iteration, which is also expected to be rolled out (although there’s still no mention – all all – of PGR students).
We are also expecting the sector to be asked its views on extending the survey to all years, which OfS suggests would allow respondents to “see and benefit from” the improvements they suggest in the survey (and the lack of progress in some cases), providing “additional information and incentives” to providers to improve the student experience. Crucially, OfS reckons that doing so would mean it can include the views of students who do not complete their courses – and might allow “greater understanding of why students drop out”. Expect the sector to start lobbying on the results of this extension to be kept confidential at provider level – and excluded from the TEF.
What’s really interesting about the insight brief is that beyond the standard results day press release, this is the first real national commentary we’ve seen from HEFCE or now OfS on the results. As OfS says, below the headlines students from minority ethnic backgrounds are less sure that marking and assessment is fair, disabled students are less satisfied with the way their course is managed, and part-time students feel isolated from the learning community. All of which prompts the question – so what are you going to do about it, OfS?
But it also prompts another question – why? Later this year we are promised some analysis of the key themes emerging from the student comment sections, which might even help both OfS and providers understand not just what students think about, say, assessment fairness, but why they think it. But generally, as long as the survey is used to encourage providers to compete with each other over their “outcomes”, we’re going to have a collaboration problem, a dearth of shared understanding of what works, and the real danger that in order to improve their scores, providers will make changes to who they recruit rather than their provision.


Really interesting piece, thanks. One of the things that’s in danger of getting lost (not in this piece) is a really important point about the NSS. The Callender, Ramsden and Griggs review in 2014 emphasised that essentially NSS was not a satisfaction survey but an experience survey – the only satisfaction question being the one about Overall Satisfaction. It’s an important point, and one that’s perhaps being lost in a lot of internal discussions within HEPs of NSS; and there’s a risk of that also happening in the national review.
The OfS may wish institutions to address the differences in scores found by student characteristics. However, for as long as they will not trust institutions with their full data and only let us have breakdowns by units which have passed the publication threshold we cannot do the necessary analysis to conclusively locate the issues. Even at a large institution very few of our subjects pass the publication threshold for every BAME group, and intersectional analysis…forget it.
The predictable answer to ‘what are the OfS going to do about this’ is not a lot: from their POV it is just another market signal like tuition fee and Ucas entry requirement. They key to how the market works is consumer information. It doesn’t necessarily have to be accurate, it just has to be out there.
Are we even slightly surprised? Ask a BAME individual what their experience of UK life is -choose any aspect you like, from job seeking to going shopping to seeking healthcare – and their reasonable response will reflect the racism and unfairness that reflects their lived experiences. It is not restricted to universities, it is just that NSS is a point where data is being created. Ask anyone with a disability the same question, again the perfectly reasonable reflection of their lived social experience is ‘inconvenient and unhelpful’ and again – sadly – not restricted to experience of HEIs. The gloomy NSS scores reflect broader impaired experiences of living in the UK, not just a below-expected experience of university, in my view.