


Five years ago, the Whatuni team started to collect student reviews in order to give us a deeper understanding of the experience students were having inside and outside the classroom.
Year on year we have grown our review collection and this year have collected and verified over 36,000 student reviews from current students. We are now sitting on a huge depth of feedback from students that we can use to understand their experience, what is meeting their expectations and where institutions are falling short.
Our reviews are collected across twelve main categories where we ask students to rate (out of five) their satisfaction with the following: job prospects, courses and lecturers, students’ union, accommodation, facilities, city life, clubs and societies, student support and giving back. We also have separate categories for students studying at an FE college or at an independent provider (although the samples are smaller here, so we have left them out of this analysis), for institutions with the most satisfied international students and postgraduates, and finally a category for overall satisfaction.
In April we published the 2018 results and here is what our data has revealed…
2017 and 2018 results across the main categories
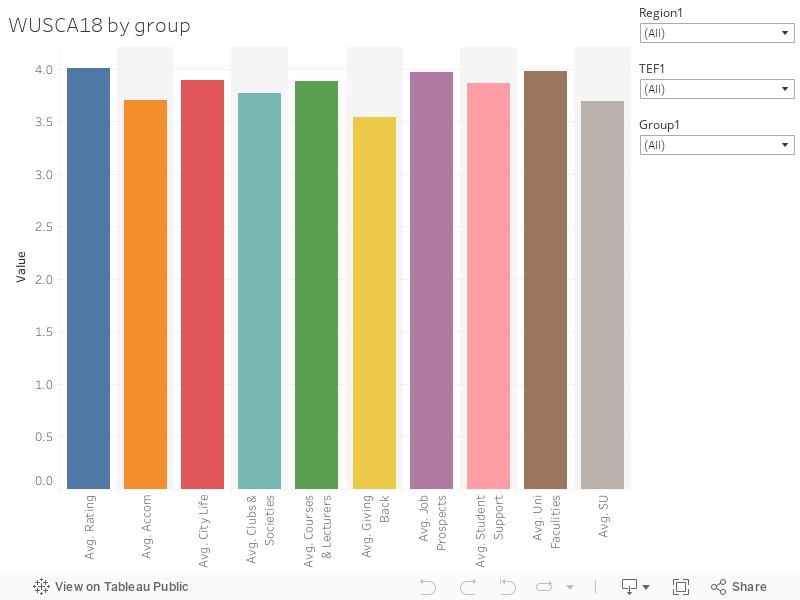
The category with the highest average is the overall category, scoring an impressive
4.01 out of 5. It remains interesting that the overall category scores more highly than the individual “component part” categories.
Good news for student employability as there’s been a particularly noticeable increase in the response in the job prospects category, which has risen from 3.88 (2017) to 3.97 (2018). And this builds on a significant growth in the previous year too.
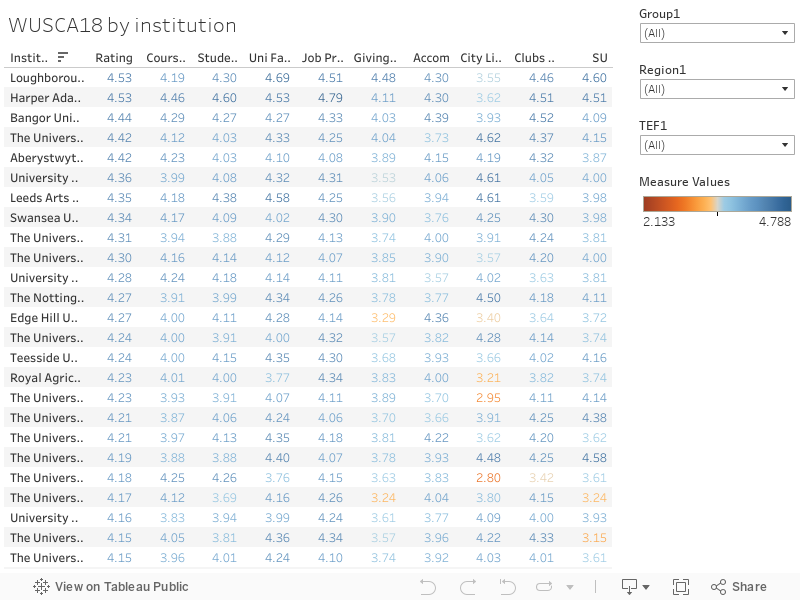
Congratulations to Loughborough University which was revealed to have the most satisfied students, pipping Harper Adams University at the post with Bangor University in third.
Although the overall category is the best scoring category, it’s actually dipped from 4.07 (2017) to 4.01 (2016). In fact, out of the 124 universities, 84 have seen their scores in the overall category drop over the last year. Although the decline is negligible in most instances, there are two universities who have dropped by 10%.
Institutions may be concerned that in addition to a drop in the overall category, there have also been falls in the accommodation, city life, courses and lecturers and clubs and societies categories. The categories proving hardest to crack are students’ union (which averages 3.69 out of 5) and accommodation (averaging 3.70 out of 5). However, the students’ union category has moved in the right direction with a marginally improved score against 2017.
Regional variations
Regionally there are some interesting variations, and the happiest students this year can be found in Wales (holding its crown from 2017). For a third year, London-based students had the lowest satisfaction score in the overall category.
Sadly, students in 8 out of 12 UK regions were less happy in 2018 compared to 2017, although students in the North East, Scotland and Northern Ireland were more satisfied this year.
Pre- vs post-1992
Breaking the results down between pre- and post-1992 universities, we find that the scores tend to be higher from those studying in the older universities across most categories, although the difference isn’t huge.
Changes over time
As we build up our results over time, we start to compile an interesting picture of the categories where scores are largely consistent over time (student support and university facilities), the categories where we can see a small but steady increase over time (students’ union, job prospects and facilities) and others which prove a little more inconsistent (clubs and societies and accommodation).
Lessons for providers – what can be done to reverse the downward trend?
In line with the National Student Survey scores, after years of small improvement in satisfaction our overall category has seen drops in 2017 and 2018. Higher education providers will rightly be asking themselves: what can be done to reverse that decline? As ever in higher education, the answer can probably be found from the students themselves. The Hotcourses team has read and validated all 36,000 reviews and there are some common lessons coming through from the student reviews.
As backed up by the results, we have seen an improvement in the scores for university facilities and job prospects and institutions should be congratulated on this. However, it has not resulted in a corresponding improvement in overall satisfaction. More striking is the regularity which students are referring to the quality of teaching, lecturers and student support in the written reviews as the key ingredients which delivers overall satisfaction. Providers may well reflect whether the balance of investment has moved too far toward buildings, and too far away from the ingredients which deliver high quality teaching such as staff student ratios, and an environment which fosters high quality learning experience. In short, while investment in new buildings may help to get students through the door, is a lack of investment in teaching meaning that institutions are now less successful at sustaining satisfaction for those students they recruit?


What does “giving back” mean?
Generally it’s about community engagement and charitable work.