


By international standards, the UK higher education sector has always done rather well on continuation.
The 2019-20 academic year, which included those terrifying first five months of the Covid-19 pandemic, was a particularly good year for students in the UK deciding to stay at university.
There was concern during that period that the uncertainty and disruption would cause more students to let go of their studies – Thursday’s data from HESA suggests that this does not appear to have happened, at least not as a general trend. The UK had its best ever year (on some measures) for non-continuation. Just 5.3 per cent of young, full-time degree entrants in 2019-20 did not continue past their first year of study. It is predicted that 82.1 per cent of those starters will complete a degree at their current higher education provider, and 9.4 per cent will do so at another provider – the best since this UKPI began.
Pretty fly for a UKPI
The original purpose of the HESA UKPI on continuation was to offer a benchmarked, comparable, UK-wide perspective on how likely students at each provider are to continue with their studies after their first year. It does this in two different ways: straight-ahead reporting of the number of students who continued with or qualified from higher education study after their first year (second year for part time), and a projection of how many students in a given year are likely to complete the course they are enrolled on.
The reported data is benchmarked to entry qualifications and subject area – and we are able to see a range of split metrics on particular groups of students.
To start with, here is the performance against benchmark for all providers.
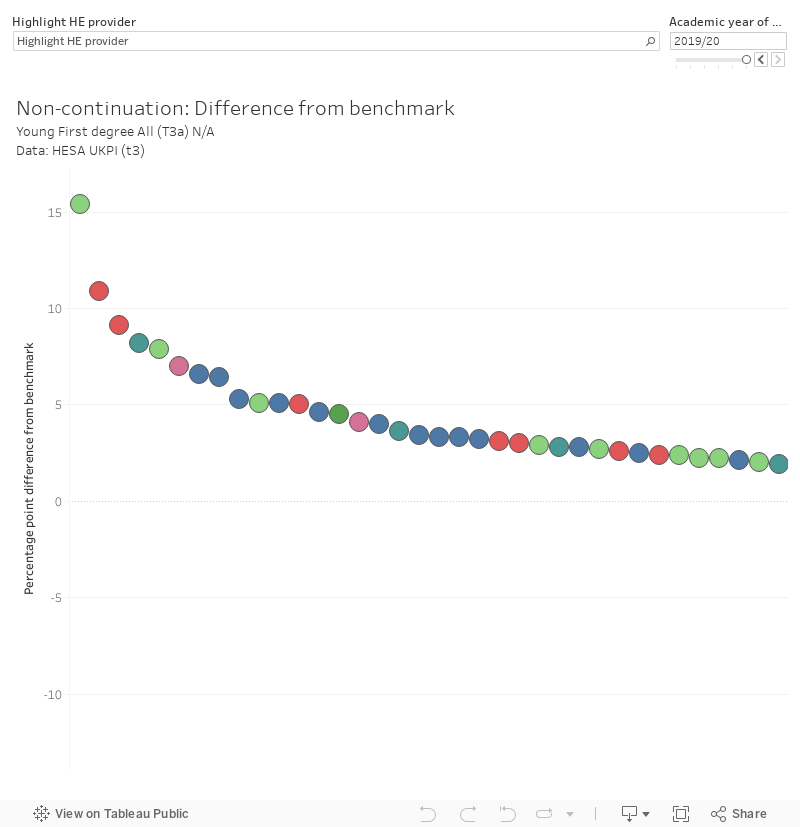
Here – positive values are a bad thing, the providers at the left saw more full time undergraduate first year students who started their studies in 2019-20 leave higher education than would have been expected.
Participation and continuation
We get to see young first degree non-continuation based on the participation rates from other backgrounds – this chart shows the proportion of students from low participation backgrounds (POLAR4 Q1) no longer in HE on the vertical axis, and those from other backgrounds (POLAR4 Q2-5) on the horizontal axis.
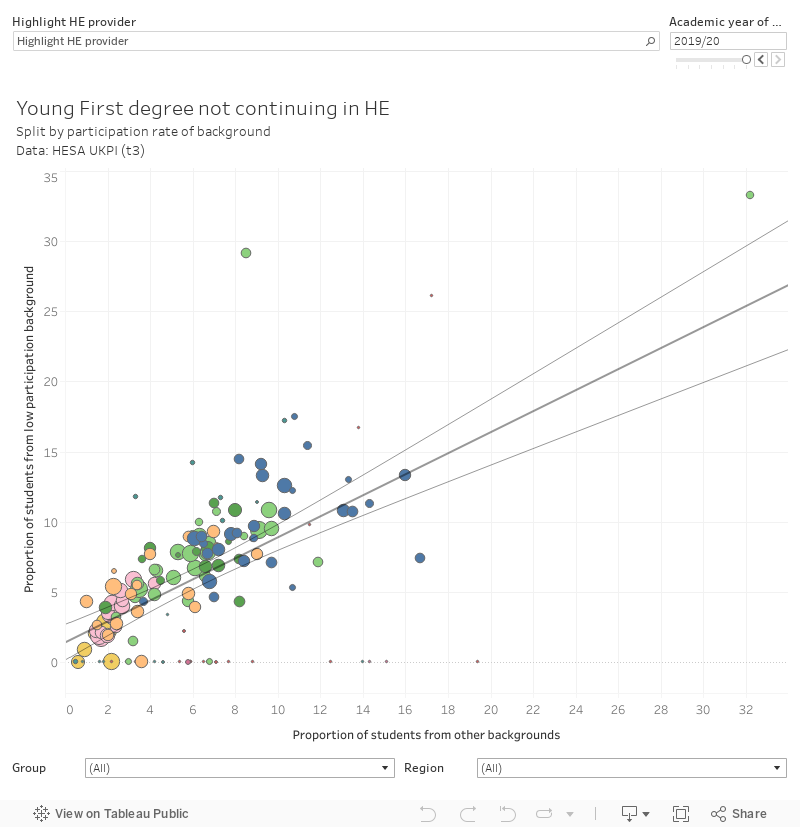
Obviously, proportions are not the best way to think about cases where low numbers of students are involved, so I’ve added an indication of the size of each provider and would caution only larger circles are of interest here. Somewhat counter-intuitively, the trend here is that providers are better at retaining students from low participation backgrounds – there’s not really correlation but it is notable.
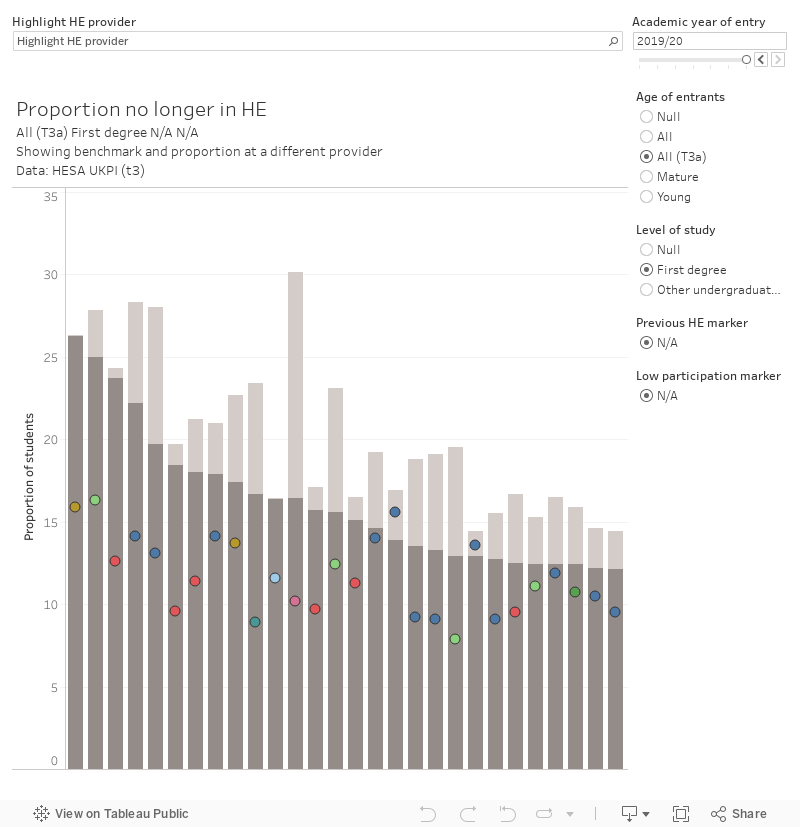
Does transference matter?
It’s reasonable to debate whether a student transferring to another provider to complete a course rather than doing so where they started is non-continuation or not. Because regulators in each sector are nominally in favour of supporting students transferring between providers – though not to the extent of actually regulating to make it easier or more common – it is not reported in the UKPI as non-continuation. But I’ve shown it in this chart so you can make your own decision.
I’ve also done a provider specific time-series version of this chart, if you want to go in deep on how things are working where you are.
Mystic HESA
Remember how I hinted that this was really two data releases in one. The other arm of this UKPI predicts the destination of entrants to full time undergraduate courses in a particular academic year – this release adds 2019-20 to this release.
These predictions are made in a fabulously technical manner that takes into account current (known) patterns of progression using a transition matrix similar to Table NC2. This only applies to full-time first degree starters – and only where there is a reasonable amount of data for the provider in question.
Here’s the chart:
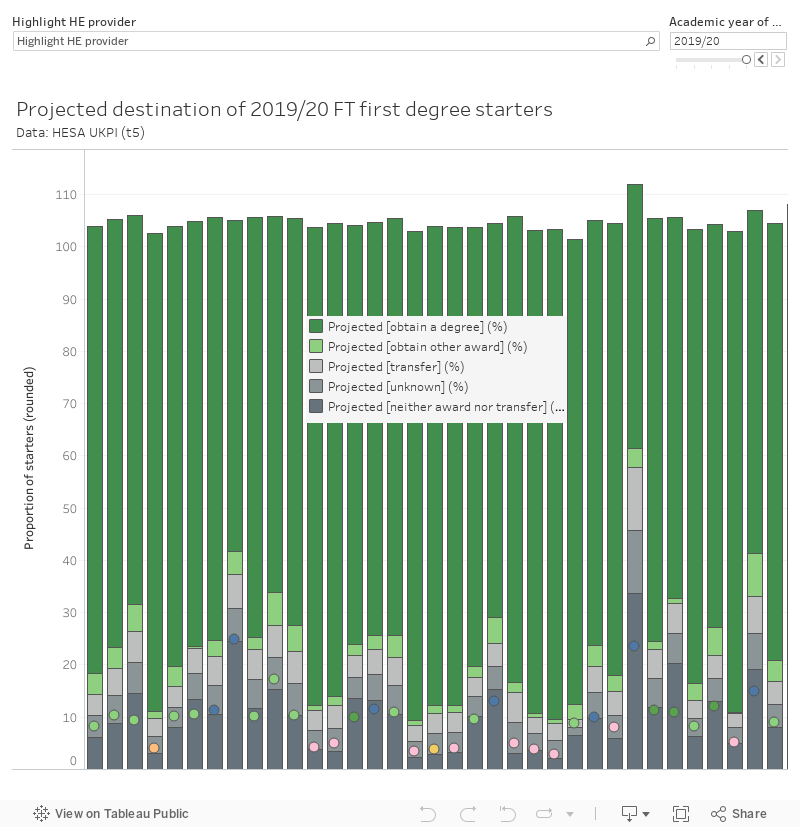
You’ll note some ugliness – there’s some rounding going on that means proportions do not add up to 100 per cent. We actually get benchmarks for each end state, for clarity I’ve only shown the “neither award nor transfer” benchmark. You’ll note a couple of providers have a larger proportion of “unknown” predictions – this will be because of recent large changes to the shape and nature of provision that can’t easily be mapped.
Nice data release you have there, shame if something were to happen to it
This is, of course, the last release of these indicators in this form. In future HESA will be releasing data on non-continuation but it may not be in this format and it will be as a part of the main open data releases. Funnily enough, OfS’ recent consultation on metrics includes a number of continuation measure proposals that owe a family resemblance to both methodologies within this UKPI – which suggests that the concerns about the current versions are about ownership rather than methodology.


Good overall but some of the individual providers – yikes!
Don’t want to spoil a rare bit of praise for the sector, but I wonder if this is at least partly driven by (a) online exams (which are harder to fail in those subjects where you are ordinarily more likely to see failure, i.e. STEM) and (b) HEIs revising their progression to permit more academic failure/resits at the end of the first year. Those are potentially positives in themselves, but they were not universally continued beyond 2019-20.
They should have helped reduce academic failure (not the only reason for withdrawal during year one, but still a key one). I wouldn’t be entirely surprised if we see a reversion in the 2020-21 cohort in 12 months time (particularly when you factor in the impact of online *learning* during 2020-21 – which may not have been the positive that online *assessment* was in 2019-20), though this may vary a lot by HEI (and without UKPIs, we’ll be reliant on the comparable OfS owned measures to identify it).
One test for those HEIs which improved the pass rate in first year in 2019-20 will be to monitor the impact on that cohort as they progress: if they don’t drop out over the following years, and graduate successfully, it should be worth revisiting progression requirements in the longer term.
” HEIs revising their progression to permit more academic failure/resits at the end of the first year”
Excellent point – yes there are a lot of students carrying a lot of resit credits – far more than is normal and there is a question with students who are already struggling if they can complete 160 or even 180 credits in a year…
Great overview
I believe this is an indication of a quiet storm.
Student cohorts > not leaving due to no jobs during a pandemic
Universities > ending remote provision/no detriment and returning to face to face, to a cohort who may have only engaged via recorded lectures / assessments
The result?
The Student Loans Company just released data on in-year withdrawals up to Feb 22, a 28% increase from 2019/2020.
I am not sure how the predicted completion metrics were created but I think institutions need to start modelling before the OFS completion threshold is finalized this September.