


With cuts in the air, it’s time to get across how much money DfE actually receives and spends – and where.
The Estimates system remains the nominal means by which the House of Commons scrutinises and approves departmental spending plans. It is obscure, complex, and little understood – I’d point to the always superb House of Commons Library who provide a very readable briefing on the process, which ends with the little-noticed passage of a Supply and Appropriation Bill.
The documents produced during the Estimates process remain the most readable version of what money each department spends in a given year. In contrast, since 1997, spending reviews set a multi-year funding envelope.
As the most recent set of Main Estimates, those for 2022-23 offer a look at the baseline from which government will form a view on what is actually spent. In-year cuts are very rare – we are far more likely to see changes to the spending review plans for future years as the government attempts to bring spending under control.
Departments can only spend money on what is in their “ambit” – a statement of the scope of activity included at the head of departmental estimates. Like most departments, DfE’s ambit for 2022-23 spans several pages and includes a fairly detailed list of everything it has been charged with doing.
Types of money
The Estimates process deals splits expenditure in two ways, we have the usual difference between capital (one off investments in resources, loans, and grants) and resource (recurrent spending) but also need to factor in the difference between departmental expenditure limits (DEL) and annually managed expenditure (AME).
Briefly, DEL is expenditure the department has control over, AME is spending where the final amount cannot be set because it is dependent on demand outside the control of the department.
So:
- Resource DEL can best be thought of as day to day spending: salaries and pension contributions, administrative costs, depreciation.
- Capital DEL is investment: in the form of grants, loans, and the purchase or improvement of major assets
- Resource AME is public spending where costs are not fixed, such as benefits and welfare.
- Capital AME is grants and loans where the amount spent is not fixed – with student loans being the canonical example
All of these, confusingly, also include income related to this expenditure including grants that departments get from elsewhere, payments from other departments, savings where planned activity hasn’t happened, and loan repayments.
Or, to give DfE and higher education specific examples:
- Resource DEL: the cost of DfE staffing dealing with higher education, some formula funding distributed by OfS. It includes a portion of the impairment charge for student loans.
- Capital DEL: the cost of these “boots on the ground” Office for Students inspections, other OfS and SFE costs, ringfenced allocations for special projects.
- Resource AME: graduates repaying interest on loans
- Capital AME: student loan outlay, less repayment of the principal from graduates.
DfE spending on Resource DEL (primarily on the schools system) is the highest of any department other than Health and Social Care, at some £73.8bn requested for 2022-23 – whereas it spends much less than others on Capital DEL (£6.4bn – less than transport, defence, health, and BEIS to give four comparators). On AME the sheer size of the student loans system makes DfE the largest single departmental capital cost, at a jaw dropping £28.7bn – representing around three quarters of the government’s total AME capital spend.
Part of the reason why this looks so bad is the 2018 Office for National Statistics reclassification of the proportion of loans that will never be repaid – once taken into account far into the future, these on-paper impairments currently feature in accounts they year the loan is issued. For more on the way this works, Andrew McGettigan’s superb analysis is on Wonkhe. In a nutshell this decision is why we had the Augar review – and why it feels like the sector has continually been seen as expensive even as real-terms income has dropped.
Here’s a look at AME and DEL, capital and resource by department for the whole government for the past few years (outturn) and the next few (planned – as covered in the 2021 spending review):
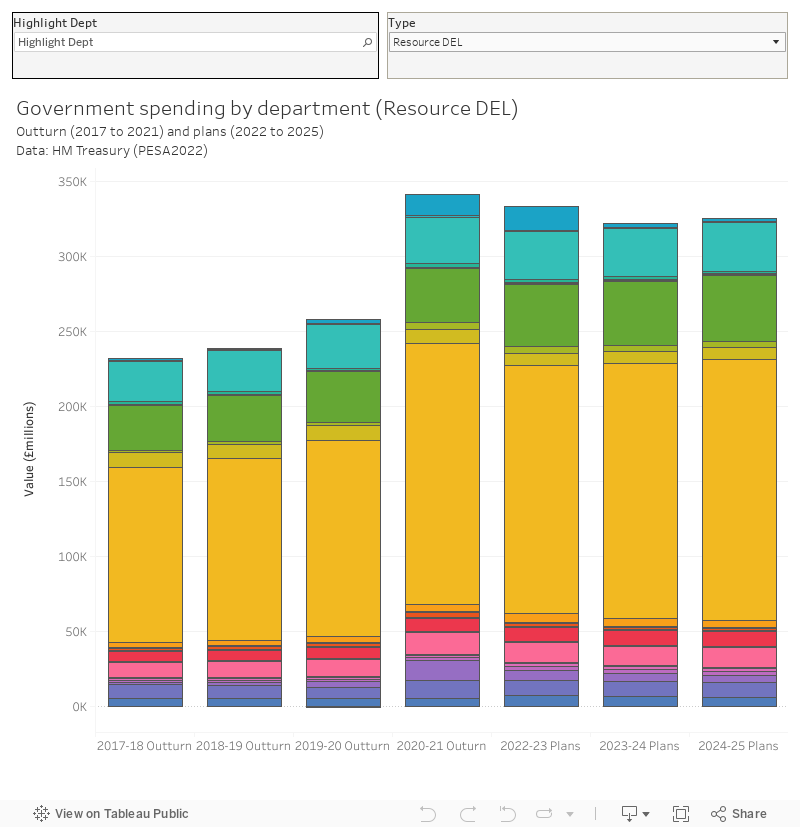
I’ve taken this data from the 2022 Public Expenditure Statistical Analyses (PESA).
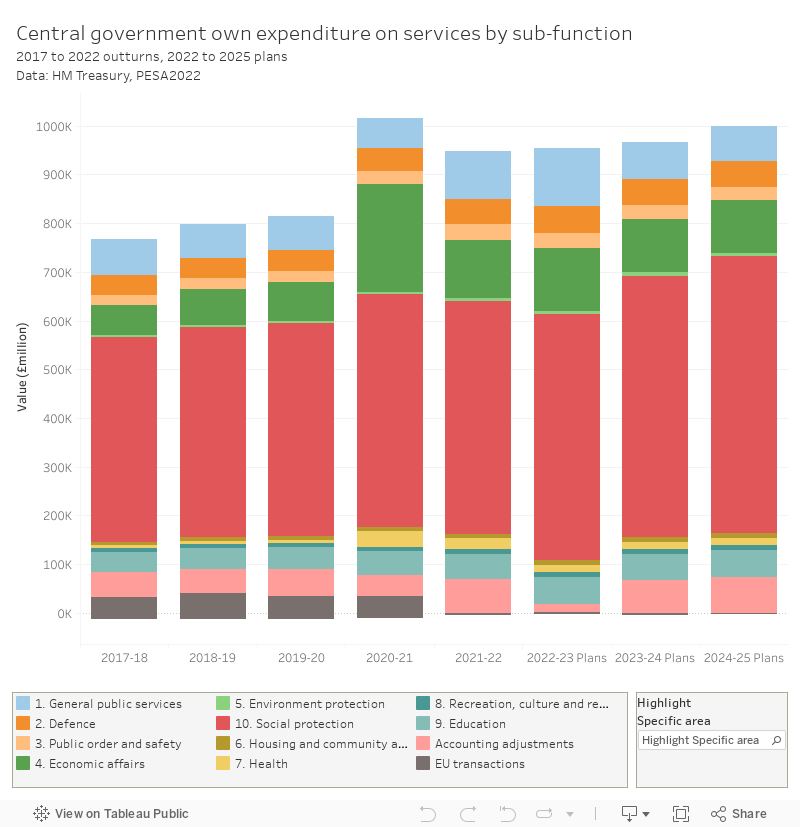
We don’t usually see higher education at this resolution, though you can find tertiary education (use the highlighter with the code 9.4) in this presentation of total managed expenditure (TME: DEL plus AME).
The mechanics of cuts
Somewhat counterintuitively, announcing large cuts to capital expenditure is generally the preferred route for belt-tightening. It allows for big numbers to be waved around to impress markets, but does not generally affect services that people use. I need hardly add that it also doesn’t do much for government spending year on year, but this is seldom the point of such exercises.
Recurrent cuts generally come in the form of freezes – these keep spending at the same cash level as previous years, but do not take account of inflation. This allows ministers to claim to be “maintaining spending” on a given policy area or public services, while making what would amount currently to quite significant cuts to the spending power of the people in receipt of these funds.
Government-wide planned spending on Resource DEL and Resource AME in 2022-23 are roughly equal, each sitting at around £320bn and £350bn, seeing Resource AME outlay drop sharply from 2021-22 as Covid-19 related spending comes to an end. Because DEL is directly controllable it is easier to ask departments not to do specific (priced) things rather than make changes to the terms of AME spending that could have an uncertain outcome on public entitlements and services – with DEL, you know what (and how much) you are cutting.
(Another) spending review
The October 2021 spending review covers planned spending for the financial years 2022-25 – setting out the funding envelope for those years and allowing for long term planning.
Raising productivity through skills reform, supporting entry to high-pay high-skill employment, and addressing Covid-19 learning loss were the three government education priorities in 2021. Enthrallingly, we also get a list of metrics attached to these, which include for DfE:
- The number of level 4 and level 5 starts and achievements
- The percentage of recent higher education graduates entering work in high-skilled employment
- Postgraduate initial teacher training applications and starts
Adding metrics to spending promises feels like a good way to close the accountability loop (in a Michael Barber-ish good delivery kind of way) but metrics can also be a hostage to fortune. Any requested cuts can be met with a demand for clarification on which of these metrics are no longer important – anything not in a metric is more likely to get cut.
It is notable that some of the things we might expect to see do not appear as metrics – there is nothing on level 6 (degree) starts or achievements, nothing on any postgraduate stuff other than ITT, nothing on widening access and participation in higher education. For higher education we are directed to the Augar review response, which as we know also included two consultations (on HE Reform and the LLE).
The response did cover some areas of investment – £300m for priority subjects, £75m for scholarships – alongside cuts to spending (the free freeze), and improvements to income from graduate repayments (the interest rate shifting to RPI+0 per cent, the new repayment threshold and terms).
Keeping the markets happy
Inflation makes everything more expensive – and makes “maintaining spending” end up as a much bigger cut than it was before.
There was a hole in the economy anyway – Covid-19 support was hugely expensive – what happened with Kwasi Kwarteng’s mini-budget was that the government appeared to deviate from widely understood (in financial circles) plans to control it. Concern about this made government borrowing more expensive, so debt also grows when it is rolled over (refinanced) by the issuing of government gilts.
All this makes it very important for the government to ensure that spending and income are balanced in the long term, and to have a credible plan for growth in the medium-to-long term. And that second goal is particularly important – lenders (personified as “the market”) are often criticised for focusing on the here and now, but in reality the emphasis is more likely to be on the ongoing health of the economy (and, the likelihood that the money they lent will be repaid).
This is why promises to cut spending in some areas one or more years ahead are preferred – it avoids immediate pain, while addressing financially aware observers’ need for spending control and a long term plan.
For that reason some cuts to public spending may end up counterproductive – if it is clear that cuts will have an impact on economic growth then lender positions will also be adjusted accordingly.
Helpful interventions
DfE officials, and indeed their counterparts in the Treasury, are not short of well-meaning advice on the best way to tweak the department’s spending to bring down the deficit, calm the markets, and set the conditions for a glorious future.
Policy Exchange, for instance, would like to stop the kind of higher education spending it doesn’t like, with the only proposal that would save any meaningful amount of money being the minimum eligibility requirements already on the table. The higher education sector itself, in the form of Universities UK and the Russell Group, seems keen to push the impact of investment in the sector on growth, and on a loosely sketched levelling up – though all this is underpinned by an acute consciousness of the plummeting value of the unit of resource (the nominal amount of funding available per student) alongside rising costs of doing business.
Departments have been asked to identify savings to be put forward to for consideration – savings of ten per cent (per department, outside of protected areas likely to include only healthcare) was the rumoured target.
The biggest higher education savings on this list are likely to come from any implementation of the HE Reform agenda consulted on after the Augar response back in February – the student number controls and/or minimum eligibility requirements are currently too loosely sketched to make a determination of the level of savings but we are looking at around £300m annually. This sounds like an awful lot of money, but it is still very small beer in terms of the Capital AME budget it would have an impact on.
But across the whole of public spending, there is a sense that those much-vaunted efficiency savings and the art of “doing more with less” have – since 2010 – meant that there is very little fat to trim.
This is going to be hard, and painful, and – crucially – unpopular.


How much would it save if the Government decided to U-turn on limiting the interest rate on student loans for new students from 2023 to RPI for the next few years and then CPI from 2030?
There are not many more progressive policies – it targets savings at the top 30% of the graduate lifetime earning distribution – and it has zero impact as the policy isn’t actually in place yet.