


HESA is to be praised for its openness in releasing experimental statistics – perfect fodder for those of a certain nature to open up Tableau and get exploring.
This set will build up into quite a nice resource – and one of the first to look at access and participation across public HEIs and alternative providers.
Here I’ve mashed them up with Wonkhe’s standard comparative data set on region, grouping (mission group and other defining characteristics), and TEF result. As usual, there’s probably a lot more in here that these interactive tables can tell you – but I was interested in what institutional groupings can tell you about widening participation performance.
Testing assumptions
There’s a whole volume of received wisdom on this topic – for instance, your average policy conference keynote speaker will happily explain:
- Post-92 providers do a better job at widening participation than their pre-92 brethren
- …but it is really alternative providers that do the heavy lifting here.
- MillionPlus is a mission group particularly focused on WP issues
- …and is a large group by volume of students
- The University of Buckingham is more like a traditional pre-92 provider than an alternative provider.
- The entry of more Alternative Providers into the sector is driving widening participation.
And now we can test these assumptions.
I’ve taken out institutions with incomplete data – so this is England only, minus a clutch of smaller APs, Heythrop College, and the Open University.
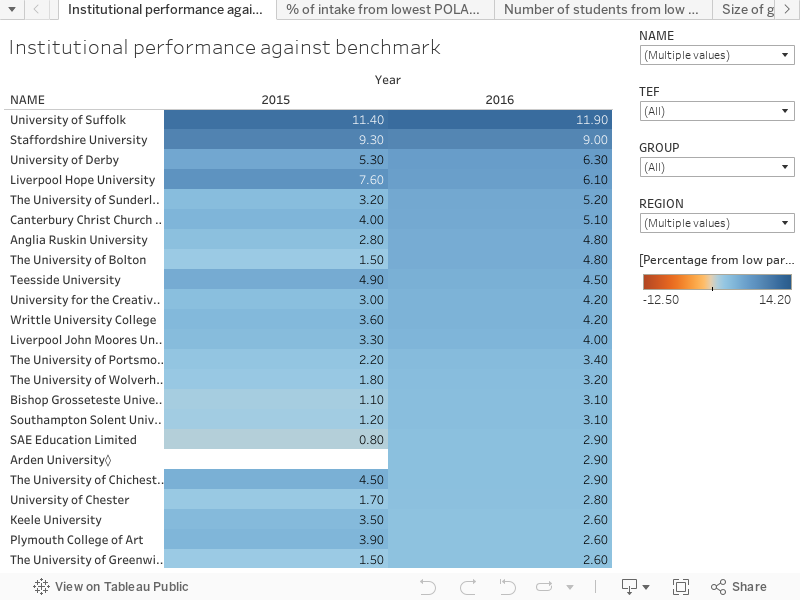
>What we see on the first tables (tabs one and two) is just your standard lists of institutional performance, both against their regionally adjusted benchmark and as a raw percentage of all entrants. The universities of Sunderland and Teesside takes the highest percentage of their intake from the least participative POLAR4 quartile, but in terms of performance against a benchmark, the University of Suffolk is the stand-out performer.
But one thing I spotted was the absence of alternative providers in the top parts of these tables – surely (I thought) it is the APs that cater to underserved groups. Wasn’t that the point of widening the HE sector – recognising that new and different institutions can do different things?
Grouping by mission
Plotting the data by group proved very interesting. Tabs three, four, and five plot – respectively – the raw number of students from low-participation backgrounds, the overall “size” of each part of the sector in students, and the percentage of total intake from low participation backgrounds.
Looking at the three graphs together shows that in terms of numbers of students and percentage of intake, Universities Alliance institutions are doing a lot to serve regions that had not traditionally participated in HE. In general, post-92 institutions have a higher percentage of their intake from such backgrounds, but in terms of raw numbers, the Russell Group actually take more POLAR4 quintile one students than Million Plus institutions!
This is an artefact of the sheer size of the Russell Group, looking at percentages makes the old “binary divide” very clear.
But what of alternative providers? Well, this is a smaller group (very similar to small and specialist institutions in overall size) but the widening participation performance of the group in percentage terms is both surprisingly low, and dropping year on year. If the present trajectory continues they will have a lower percentage of their intake from POLAR4 quintile one than the Russell Group by next year.
(Private – incidentally – is my way of separating out the University of Buckingham. A unique institution in many ways, I didn’t feel I could fairly add them to any other group.)


Interesting statistics, but not at all surprising to anyone who has worked in an alternative (/private) provider. There is a huge flaw in the idealistic notion of these smaller, specialist providers helping widen participation: private providers are businesses. They need to offset their costs with revenues and, in many cases, their only revenue stream will be the fees they bring in. Maybe, after the organisation has been running a few years they can start diversifying with alumi donations or strategic partnerships involving larger companies subsidising scholarhsips.
Unless a private provider is part of a larger business or MNC, and allowed to be a loss leader for that business, you won’t see this change at all. Only someone like Google or Amazon or Apple are in positions to do something really innovative in this space, but would they ever take the huge financial burden of doing this? Actually, Facebook could do with a PR win at the moment…
I’m not totally against private providers, but to frame them as drivers of widening participation is foolhardy. Traditional HEIs (ideally with robust government funding) are and will likely always be the best option. For me, Apprenticeships succeed where this ill-thought out and naive policy was always destined to fail.
This analysis looks incomplete to me. Where, for example, is Sheffield Hallam University?
Interesting analysis, but the issue is the HESA data for APs is not comprehensive (particularly for 2015 and 2016) and therefore a true comparison can’t be done. What is also missing is the data for FE Colleges to show there role in widening participation for HE.
Hopefully with all providers being treated equally under OfS registration we will get a clear picture on who actually does the heavy lifting when it comes to widening access.
Have you accounted for the mature students? AFAICS, GSM London (just as an example) has 495 young entrants with data out of 2,845 total entrants. This doesn’t bear comparison with even the likes of UEL (55.7% young entrants) or LSBU (50.2% young). This doesn’t seem to provide a basis to say whether GSM is better or worse at WP than traditional London new universities.
This is a story about POLAR and its limitations as a proxy for WP – particularly in London, home of many APs. You seem keen to draw more sweeping conclusions about whether or not APs “cater to underserved groups” but that is simply not possible from this single data point.
Mature students, students with disabilities, students who need flexible options like blended learning, evening classes or block release, students who need pre-Bachelor’s access and foundation courses… all examples of underserved groups to which some (not all) independent providers tailor their provision.
You ask “Wasn’t that the point of widening the HE sector – recognising that new and different institutions can do different things?”
Absolutely it was, but I’m not sure this rhetorical flourish sits very comfortably within the narrow confines of the data you analyse here.