


Around 14 million exam scripts (that’s 2.66 A levels per student) have been marked and cross-checked over the summer, and today saw the release of these results to students and HE providers.
Results day is both an intensely personal experience and a national spectacle. Whatever is said about trends overall means little to the prospective students who will spend the day online or on the phone, dealing with unexpected results that may feel like they change the course of an entire life. But of all the things (good and bad) that will change the course of your life, A levels rank fairly low – perspective not often available to those in the midst of the process. Not many of those applying to university read Wonkhe, but for those that do we hope you find the option for the next three or more years of your life that is best for you.
A further 19 new A levels – ranging from further maths to media studies, via Russian and politics – mark year three of the four year programme of A level reforms first kicked off by Michael Gove back in 2014. Though these qualifications cover an updated and refocused curriculum, anyone who has had any contact with a young person over the last few years will be aware that these qualifications are linear – assessed primarily via an end of course exam.
Though not designed to be more difficult (that was the GCSEs), the new A levels are a very different experience for those taking them. The pedagogic reasoning for shifting so much weight to a final exam is unclear – end-of-course assessments are (in the main) less good at assessing creative thinking, reasoning, and deep understanding than continuous assessment. Final exams are a great measure of the quality of exam preparation – be that a systematic programme of in-class revision, or extra-curricular coaching.
There’s also a participation angle – less confident students from less academic backgrounds may choose not to study courses perceived as harder where the focus is primarily on a single exam.
Ofqual, the assessment regulator in England, prescribes a system of “comparable” outcomes to ensure that we don’t see the kind of volatility in national results that could destroy the career of a Secretary of State for Education. Ofqual wrote a letter to universities (and, we assume, other HE providers) covering this back in May.
What A levels do students choose?
Students making their A level decisions back in 2017 wouldn’t have enjoyed the benefit of this year’s clarifications on the idea of “facilitating subjects” from the Russell Group. In the past, a list of key subjects was promoted to ambitious students as the pathway to a place at a selective university. The old facilitating subjects – maths, further maths, English literature, physics, biology, chemistry, geography, history and languages – still make a strong showing, but there are notable drops for maths, further maths, and English literature.
The changes to the latter – which focuses a lot more on the memorisation of text – may have prompted students to decide against taking the subject, according to a report in the Guardian. However, as we will see, there wasn’t a meaningful change in outcomes.
What results did they get?
The overall A level results are published as a pdf (eventually, when they fix their website) by the Joint Council for Qualifications, the morning after they are released to universities, schools, and students. Ofqual also release data (for England only) which is what I present here. As soon as I’ve disentangled the JCQ data from the pdf I’ll add that too.
[EDIT: I’ve now done that and the graph is at the bottom of the page]
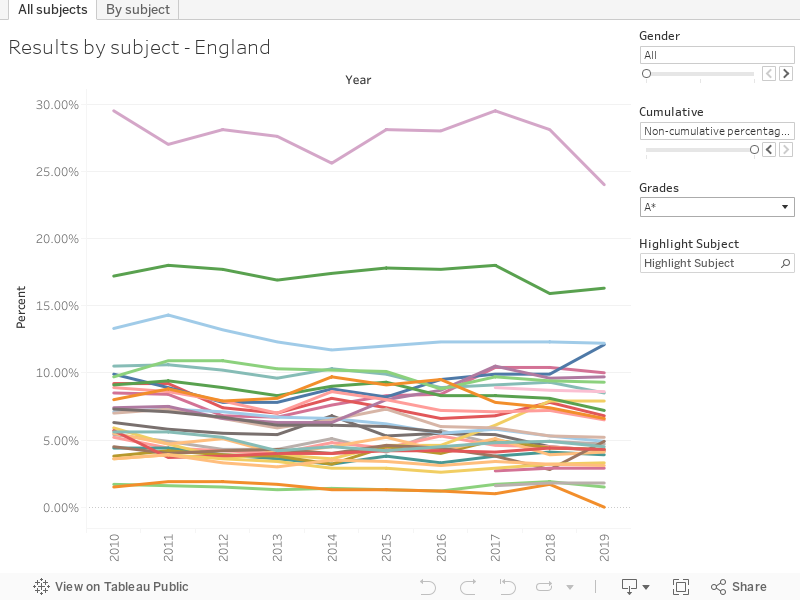
The two big stories have been a drop in A* grades from last year, and women achieving more higher grades (number, not percentage, grade A and above) than men for the first time. The latter puts paid to a lot of sexist nonsense about women somehow benefiting from modular assessment, but the former is interesting for policy reasons.
As above, grades are not set in stone – the boundaries move each year to keep results broadly equivalent (a candidate with the ability to get a B in maths last year should get one this year). So the drop in the very highest grades can only mean that nationally we feel this year’s students are less able than last year, or awarding bodies (and by extension the government) wants to look tough on “grade inflation”. This is a trend that has continued since 2017.
However, there is a difference by subject – Further maths shows a hefty decline in A* grades, whereas German shows growth. But overall the trend is downward.
Horror stories
Young people spend possibly the two hardest years of their lives learning to jump through the A level hoop – so of course our responsible national press recognises this difficult work and personal fortitude in the days coverage. Or not, as the case may be.
We can guarantee at least one article (with colour quotes from Chris McGovern of the Campaign for Real Education or Alan Smithers of the University of Buckingham) decrying falling standards and “Mickey Mouse” courses. It’s a tradition as hackneyed as the picture of the blonde women jumping in the air – the latter has gone, thankfully, and we should really be calling time on the former.
This year the standards of these knocking articles have slipped even further. The Sunday Times splashed on the idea that 48 per cent of (essay-based) A level results are “wrong” – which prompted a delightful correction from Ofqual that could only really be improved if it was written in red ink. For many subjects, marking is based on qualitative criteria that rely on academic judgement. There will be variation, though a well argued and well constructed essay will always win out.
And The Times’ Sian Griffiths reported that some students would get the highest grade without achieving a particularly high percentage mark. As we all know this is due to the Ofqual quest for “comparable outcomes” if you change the assessment method to one that gives students more trouble, the average marks for each grade will be lower assuming the population taking the exam has broadly the same characteristics. The whole set of boundaries leaked yesterday on social media to generalised merriment.
Away from A level performance, the classic “Mickey Mouse” courses article came from the Mail this year – an annual failure to understand the idea of niche courses serving a specific local needs, the need to widen participation, and the limited utility of A levels in solving either issue. And – yes – there’s a “Campaign for Real Education” quote.
Admissions – new for this year
UCAS has made changes to the application process, making it easier for students to “self release” from their firm offer. In the past this required a phone call to the institution, now the option is just a click away. This will speed things up for students looking to enter Clearing or adjustment after a surprise on results day.
Some of the thinking behind this aimed at encouraging students into adjustment – a little known facet of the UCAS systems that allows students performing better than expected to “trade up” to a place with a higher standard entry requirement. Of course, the fact that neither UCAS nor Unistats hasn’t historically allowed you to search for courses by entry requirement is the main stumbling block here. UCAS has added this in as “beta” functionality for this year, although there are still some teething issues, not least that subject requirements (eg maths for engineering or physics courses) can’t yet be taken into account. UCAS are committed to working on a better information and advice offer for students, of which this beta will form a part.
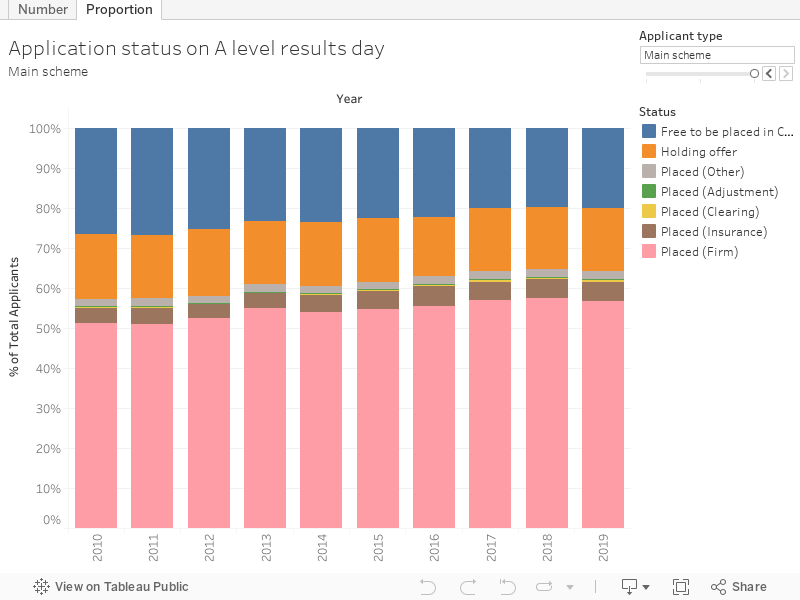
Application status
But there’s been a 1 per cent decrease in placed students over this time last year – despite the availability of this new route, and – frankly – the moral panic over unconditional offers. Either of these could have led to an increase in those without a firm university place at this point – instead we see slow growth continuing in the proportion of 18 year olds in the system, with the 1.9 percent population drop manifesting as the one per cent drop.
We see a very slight increase in the proportion of students free to be placed in clearing, but only back to 2017 levels after a drop last year. When adjustment (lunchtime) and clearing (3pm) open today we’ll start seeing some more movement. Tomorrow’s stats – handily presented on a dashboard by UCAS, will be worth a look.
I had a chat to Richard O’Kelly, Head of Analytical Data at UCAS, who told me he felt self-release will become a fundamental part of HE admissions in future, highlighting the ability for prospective students to release themselves from unconditional offers. As providers increasingly recruit via clearing (we reckoned that just about everyone is involved in clearing now) it is becoming a key route to admitting talented applicants. Self-release into clearing may even replace adjustment.
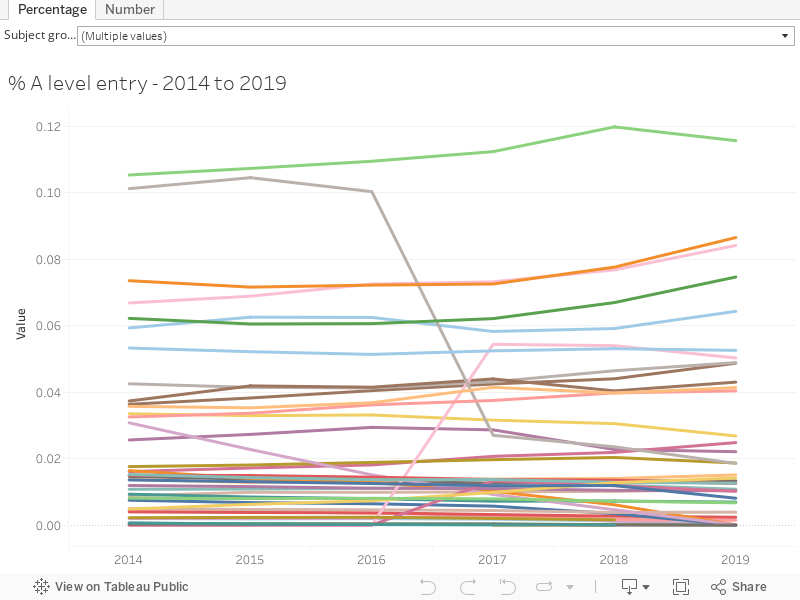
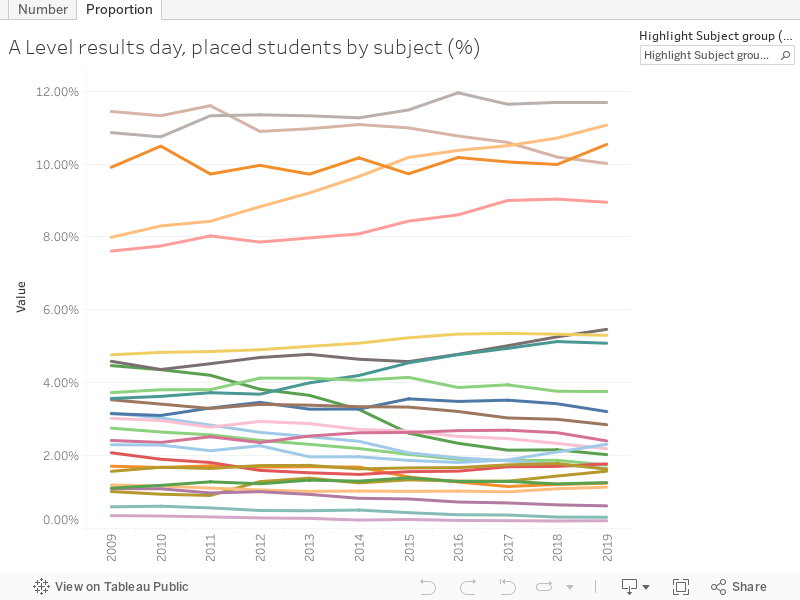
Placed by subject
Large increases in students placed on biological science and subjects allied to medicine courses suggests that continued negative publicity around creative arts subjects is having an effect. Back in 2008 creative arts was the most popular subject area to study, on A level results day 2019 it now sits behind business studies and the two mentioned above. Elsewhere the growth of law as a subject of study continues, as does the slow decline of modern languages. Medicine and Dentistry have grown due to the increased number of places available.
The top level subject categories hide a multitude of sins – UCAS know from surveys of prospective students that the range of modules available is a big selling point for students – so it should not even be assumed that those on a course with a similar name are studying a similar thing, much less at subject level.
Richard added that the same survey offers reasons for the changes we do see – prospective students are increasingly choosing courses based on a planned future career. A small drop in computer sciences applications suggests that this may be on a short timescale – post-graduation surveys show low initial employment rates, despite the coding institute (and others) call for more skilled graduates.
Again, all of these need to be watched during clearing – it would be fascinating to see which subjects attract more clearing students.
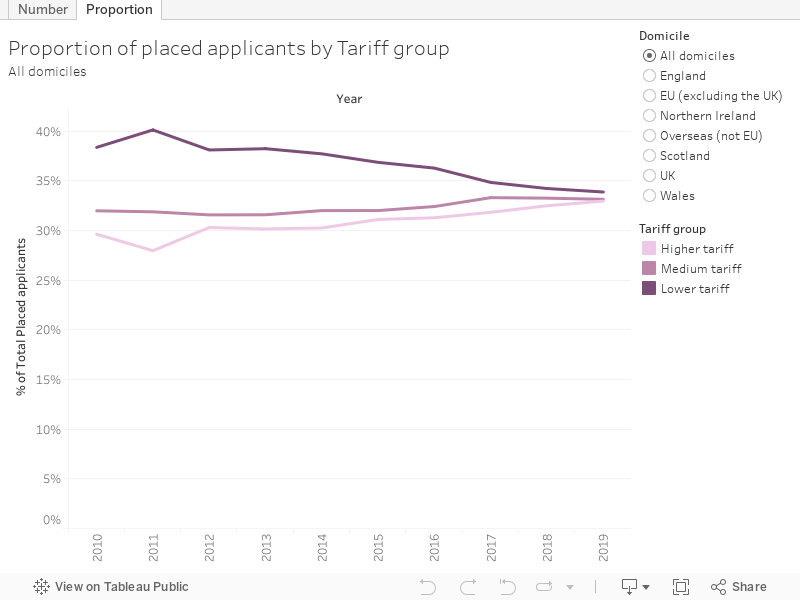
Tariff bands
For analysis of what types of provider students are confirming places at UCAS band institutions into three tariff bands. This year sees the three reach parity, with near enough a third of all placed students in each of low, middle, and high tariff providers. You may suggest that this is a little silly as different courses will have wildly different entry requirements at the same provider, and you would be right.
Richard O’Kelly at UCAS notes that methodological changes to this calculation are on their way – and that the split is made based on recruitment at the end of the cycle. He postulates that the system is self-righting after the relaxation of student number controls in the early part of this decade saw a growth in recruitment at high tariff providers.
It’s also worth noting that subject choice is a factor here – some specialised institutions will have higher tariffs than for the same course at a larger provider.
However, two thirds of overseas students have been placed at “high tariff” providers, as have just over two fifths of non-UK EU students. So for those entering the UK to study, tariff is clearly important.
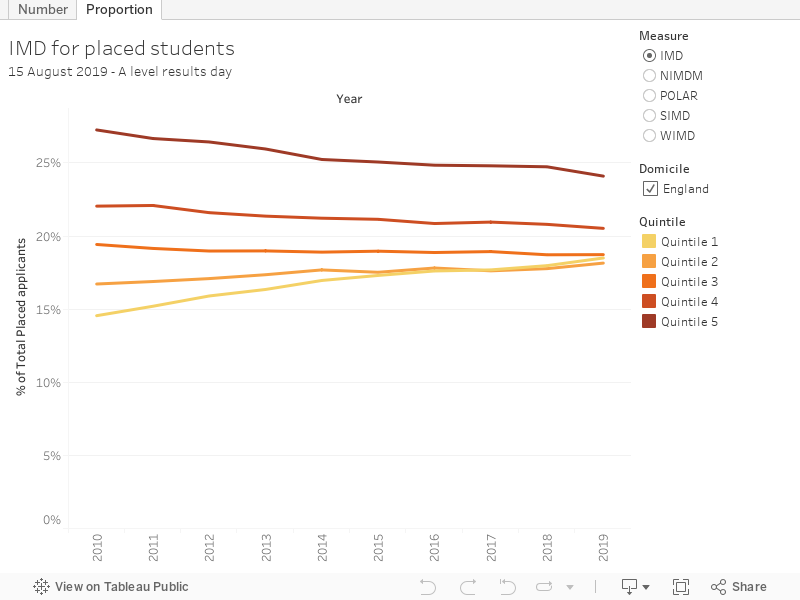
Participation
We have a choice of measures covering low participation areas and areas of multiple deprivation, the latter differing in construction by country. The English and Scottish IMD graphs are of interest, each shows that quartile one has overtaken quartile two and is nudging at quartile three. In Scotland (though as always with Scotland, remember the UCAS statistics are only a proportion of the whole admissions picture) this has been due to a long standing policy commitment to address this issue.
UCAS highlight the POLAR4 Q1 growth in entry rates at age 18 as an interesting development.
Plotting the ethnicity of placed applicants as proportions also shows an improvement in diversity for the UK as a whole, but some interesting changes at a national level.

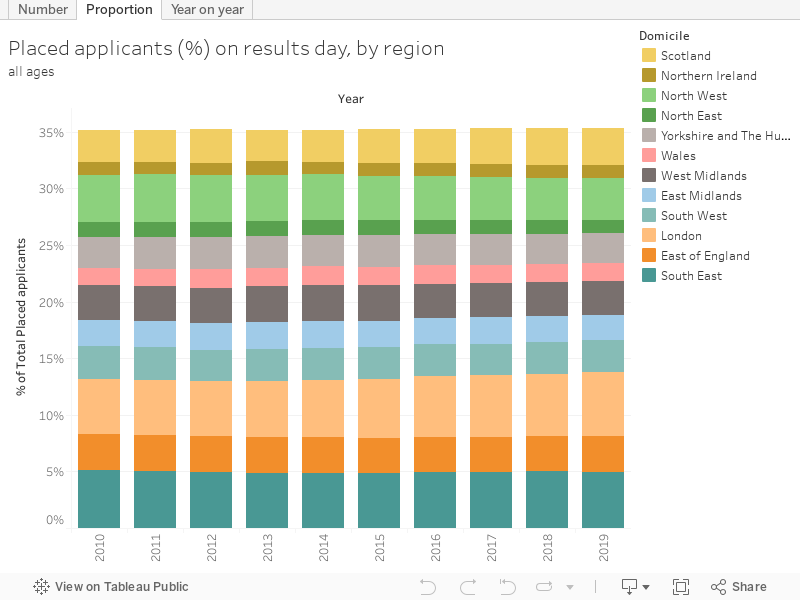
Looking by region for all students sees London, the East of England, and Northern Ireland growing their share of placed applicants, at the expense of another fall in the North East. Richard at UCAS noted that in terms of entry rate (proportional to the number of 18 year olds in each region) the number the North East has remained stable while all others have grown.
DfE research has shown that trends in aspirations and outcomes by region are set at around age 13 (year 9), and maintain similar proportions from then on. So there is a lot more work to do before these regional disparities are fully addressed.
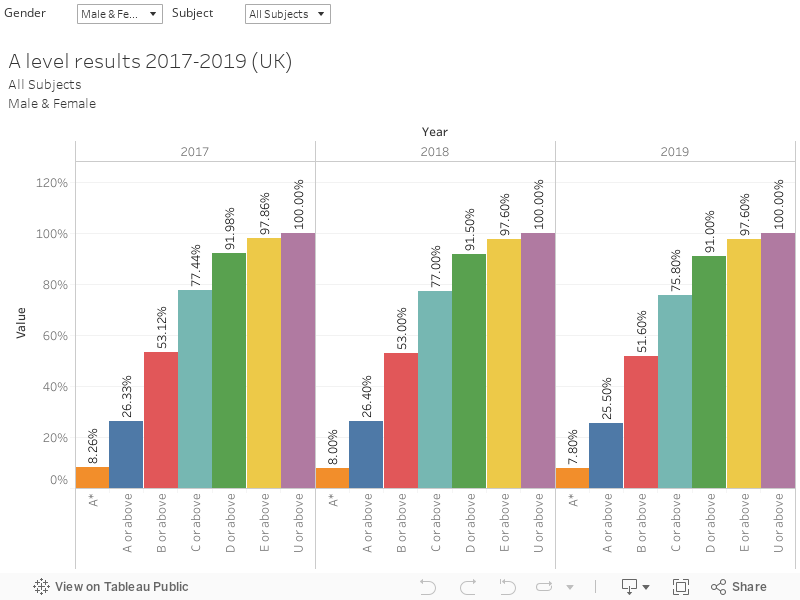
Bonus content – JCQ data for UK
I’ve used a slightly different visualisation style here, which shows that this year’s students do appear to have performed slightly less well than in 2018 and 2017.


That’s a great summary. The first paragraph resonated with my daughter getting her results today. Oh and that Ofqual quote burns 🙂
The big change has surely been from modular to linear examinations, rather than from continuous assessment to exams ?
Pluses and minuses there – from a teaching perspective, there’s no doubt in my mind that in the subjects I teach, a modular approach discouraged deep learning – it encouraged teaching to the test, learning the exam papers and markschemes more than the subject, and discouraged making the links between different areas of the subject that are crucial to deep understanding.
However, modules did make a real difference for anxious examinees- knowing they had something in the bag already helped them relax a little and so actually do their best in later exams. The modular AS and A2 structure also encouraged breadth – it is very sad to see the return to narrowing options so much at 16.
Coursework is still a thing in some A-levels – it’s not gone entirely. And in some subjects it can be an excellent test of those skills and abilities not testable in an exam. But … it is so susceptible to unfair practice. And those from advantaged backgrounds too often have many more ways to “enhance” their coursework marks than their less privileged peers. Also, the sad fact of the matter is that some teachers in some schools give unfair help. And whilst we could readily fulminate against this practice, it is pretty well inevitable it will happen in a climate in which teachers and schools are considered so responsible for a pupil’s result.
Thank you for this great summary. I wonder if there is any research looking at any impact of unconditional offers on grades achieved? I guess it could go either way: taking away the stress leads to better performance; removing the motivation to achieve high grades leads to lower performance.
Really interesting. It would be great to see the same analysis completed for IB and especially BTECs to explore whether there are any emerging trends in these.