

This world university league table first appeared in 2010 and was headed by the University of California, Berkeley. Last year the University of Nottingham held the top spot. And Nottingham has done it again this time
The top 10 is follows:
- University of Nottingham UK
- University of Connecticut US
- University of California, Davis US
- University College Cork IRE
- University of Oxford UK
- University of California, Berkeley US
- University of North Carolina, Chapel Hill US
- University of Bradford UK
- Universite de Sherbrooke CAN
- Northeastern University US

The details of the table can be found at the UI GreenMetric site.
The methodology can be summarised as follows (not wholly clear you have to say):
- The philosophy
We based our instrument on a broad philosophy that encompasses the three Es: Environment, Economics and Equity. - The criteria
We selected criteria that are generally considered to be of importance by universities concerned with sustainability. These include the collection of a basic information of the size of the university and its zoning profile, whether urban, suburban, or rural. Beyond this we would like to see the degree of green space. The next category of information concerns about electricity consumption because of its link to our carbon footprint. Then we want to know about transport, water usage, waste management and so on. Beyond these indicators, we would like to get a picture about how the university is responding to or dealing with the issues of sustainability through policies, actions, and communication. - Scoring
Scoring for each item will be numeric so that our data can be processed statistically. Scores will be simple counts of things, or responses on a scale of some sort. - The weighting of criteria
Each of the criteria will be categorized in a general class of information and when we process the results, the raw scores will be weighted to give a final calculation.
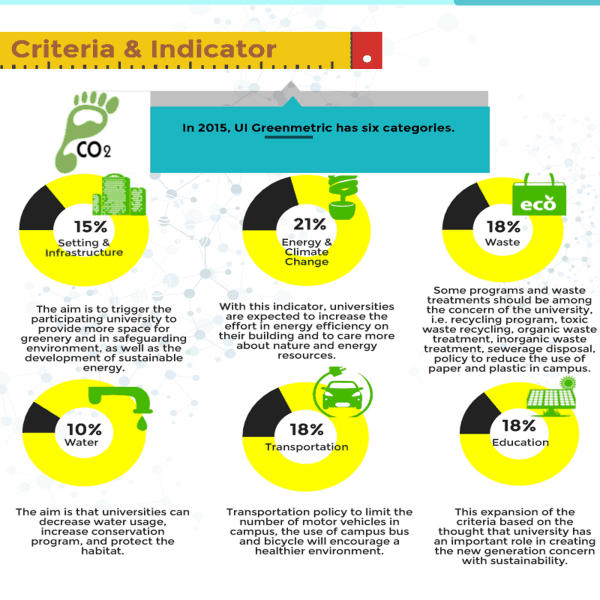
And there is comprehensive breakdown of the criteria here but in summary it looks like this:
Overall a good result for UK institutions and Nottingham in particular (as well as for Oxford and Bradford in the top 10 and Sussex at 11 and Nottingham Trent in 15th place). The number of institutions participating this year remains substantial and this league table continues to become more established.


